. 2012 Nov;61(11):2922-31.
doi: 10.2337/db12-0004. Epub 2012 Aug 7.

Alterations in lipid signaling underlie lipodystrophy secondary to AGPAT2 mutations

Affiliations

Alterations in lipid signaling underlie lipodystrophy secondary to AGPAT2 mutations

Angela R Subauste et al. Diabetes. 2012 Nov.

Erratum in

  • Diabetes. 2013 Mar;62(3):998. Elliot, Brandon [corrected to Elliott, Brandon G]

Abstract

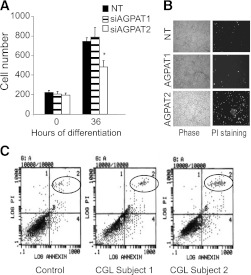
Congenital generalized lipodystrophy (CGL), secondary to AGPAT2 mutation is characterized by the absence of adipocytes and development of severe insulin resistance. In the current study, we investigated the adipogenic defect associated with AGPAT2 mutations. Adipogenesis was studied in muscle-derived multipotent cells (MDMCs) isolated from vastus lateralis biopsies obtained from controls and subjects harboring AGPAT2 mutations and in 3T3-L1 preadipocytes after knockdown or overexpression of AGPAT2. We demonstrate an adipogenic defect using MDMCs from control and CGL human subjects with mutated AGPAT2. This defect was rescued in CGL MDMCs with a retrovirus expressing AGPAT2. Both CGL-derived MDMCs and 3T3-L1 cells with knockdown of AGPAT2 demonstrated an increase in cell death after induction of adipogenesis. Lack of AGPAT2 activity reduces Akt activation, and overexpression of constitutively active Akt can partially restore lipogenesis. AGPAT2 modulated the levels of phosphatidic acid, lysophosphatidic acid, phosphatidylinositol species, as well as the peroxisome proliferator-activated receptor γ (PPARγ) inhibitor cyclic phosphatidic acid. The PPARγ agonist pioglitazone partially rescued the adipogenic defect in CGL cells. We conclude that AGPAT2 regulates adipogenesis through the modulation of the lipome, altering normal activation of phosphatidylinositol 3-kinase (PI3K)/Akt and PPARγ pathways in the early stages of adipogenesis.


Figures

FIG. 1.
FIG. 1.
Defective adipogenesis in CGL MDMCs. A: Formation of multinucleated cells in culture of CGL MDMCs (arrows). Cells were incubated in myocytic differentiation media (2% horse serum) for 10 days. Inset shows MF-20 staining. B: Expression of myosin heavy chain in CGL MDMCs after myocytic differentiation. *, P < 0.05. C: Oil Red O staining of control and CGL MDMC culture after 12 days of differentiation in adipogenic media (×10). D: mRNA profiles of control and CGL MDMCs after the addition of adipogenic media. Expression levels were normalized to 18s mRNA. C/EBPα and PPARγ were not detected in CGL-derived MDMC cultures. Points represent an average of two experiments. E: Rescue of adipogenesis by expression of GFP-AGPAT2 in CGL MDMCs. a: Phase contrast image demonstrating the accumulation of lipid droplets (arrows). b: Cells showing GFP expression under fluorescent microscopy (original magnification ×40). F: mRNA expression in CGL MDMCs after expression of GFP-AGPAT2. (A high-quality digital representation of this figure is available in the online issue.)
FIG. 2.
FIG. 2.
AGPAT2 downregulation inhibits adipogenesis in 3T3-L1 cells. A: Changes in AGPAT mRNA levels in 3T3-L1 cells 48 h after treatment with nontargeting (NT), AGPAT1, or AGPAT2 siRNA. Expression levels were normalized to 18s mRNA levels ± SD. *P < 0.05. B: Oil Red O staining of 3T3-L1 cells after 7 days of differentiation in adipogenic media after treatment with NT, AGPAT1, or AGPAT2 siRNA. Original magnification ×10. C: Levels of adipogenesis-related genes after 4 days of differentiation after treatment with scrambled siRNA or AGPAT siRNA. Values are the mean of three independent determinations ± SD. *P < 0.05. D: PPARγ protein levels in 3T3-L1 cells expressing pc-DNA or V5-AGPAT2 after 48 h of insulin stimulation (300 nmol/L).
FIG. 3.
FIG. 3.
AGPAT2 loss increases cell death in 3T3-L1 preadipocytes and CGL MDMCs. A: Quantification of cell number of 3T3-L1 cells treated with AGPAT2 siRNA at day 0 and 48 h after the addition of adipogenic media. n = 3. *P < 0.01. B: Propidium iodine (PI) staining of 3T3-L1 cells after siRNA treatment. Bright field (left). Cells under fluorescent microscopy (rhodamine filter) (right). C: Fluorescent cell sorting of control and CGL cells at baseline and 4 days after the addition of adipogenic media. Annexin fluorescence is the x-axis and propidium iodide fluorescence is the y-axis. Note increase in cell death in CGL cells at day 4.
FIG. 4.
FIG. 4.
Effect of AGPAT2 on insulin signaling events in 3T3-L1 cells and human MDMCs. A: MDMCs from control and CGL subjects were starved for 6 h in serum-free media and treated with insulin (50 nmol/L). Protein extracts were probed with the indicated antibodies. B: Effect of AGPAT2 siRNA on Akt and S6K1 phosphorylation after 6 h starvation for serum and treatment with insulin (50 nmol/L). C: Cells were transfected with either pc-DNA, V5-AGPAT1, or V5-AGPAT2 for 2 days. After 6 h starvation, cells were treated with 50 nmol/L insulin, and protein extracts were probed for the indicated antibodies. D: 3T3-L1 adipocytes were exposed to buffer (a) or 59 μmol/L insulin (b), fixed, and immunostained for FoxO1. Note the nuclear exclusion of FoxO1 after insulin stimulation. GFP-AGPAT2–transfected 3T3-L1 adipocytes were serum starved and immunostained for FoxO1 (c) or GFP visualized (d). Merged figure (e) shows reduced FoxO1 in GFP+ cells. Arrow depicts cell not expressing GFP-AGPAT2 with nuclear localization of FoxO1. E: 3T3-L1 cells treated with scrambled or AGPAT2 siRNA and transfected with myr-Akt where indicated. Cells were harvested after 4 days of differentiation, and mRNA levels were quantified. n = 4 for each condition; mean ± SD. *P < 0.05. F: Oil Red O staining of 3T3-L1 cells after 7 days of differentiation in adipogenic media after treatment with scrambled siRNA (nontargeting [NT]), AGPAT2 siRNA, or AGPAT2 siRNA with myr-Akt. Original magnification ×20. (A high-quality digital representation of this figure is available in the online issue.)
FIG. 5.
FIG. 5.
AGPAT2 increases PIP2 and PIP3. A: 3T3-L1 cells expressing GFP or GFP-AGPAT2 were harvested under basal conditions. Lipid extracts were analyzed with LC/MS. n = 5 for each condition; mean ± SD. *P < 0.05. B: Immunostaining for PIP3 of cells after 6 h starvation and insulin stimulation for the indicated times. C: PIP3 blot from lipid extracts of the same cells in serum-replete media. D: 3T3-L1 cells transfected with either empty vector or AGPAT2 were starved for 6 h in serum-free media and treated with LY294002 10 nmol/L for 20 h, where indicated. Protein extracts were probed for the indicated antibodies.
FIG. 6.
FIG. 6.
AGPAT2 increases PPARγ transactivation independent of PI3K. A: NIH3T3 cells were transfected with empty vector, AGPAT1, or AGPAT2 and PPREx3-LUC reporter, RXRα, and PPARγ. Cells were treated with rosiglitazone for 20 h, and relative luciferase activity was quantified. n = 4 for each condition; mean ± SD. *P < 0.05. B: PPARγ protein levels at 48 h of transfection. β-Actin was used as loading control. C: NIH3T3 cells were transfected with empty vector or AGPAT2 and PPREx3-LUC reporter, RXRα, and PPARγ. Cells were treated with LY294002 (10 nmol/L) for 20 h, and relative luciferase activity was quantified. n = 3 for each condition; mean ± SD. *P < 0.05.
FIG. 7.
FIG. 7.
Effect of AGPAT2 on glycerophospholipids. A: 3T3-L1 cells were treated with siRNA either nontargeting (NT) or AGPAT2, and LPA levels were determined through LC/MS after 3 days. n = 4 for each condition; mean ± SD. *P < 0.05. B: 3T3-L1 cells overexpressing AGPAT2 or empty vector underwent lipid extraction and subsequent thin-layer chromatography separation. Phosphatidic acid and LPA levels were determined. n = 4 for each condition; mean ± SD. *P < 0.05. C: 3T3-L1 cells treated with scrambled or AGPAT2 siRNA were harvested and phospholipids were extracted for LC/MS analysis. CPA levels were determined after 3 days. n = 4 for each condition; mean ± SD. *P < 0.05. D: Quantification of CPA by LC/MS levels in 3T3-L1 cells overexpressing GFP or AGPAT2. n = 4 for each condition; mean ± SD. *P < 0.05. E: NIH3T3 cells were transfected with empty vector or AGPAT2 and PPREx3-LUC reporter, RXRα, and PPARγ. Cells were treated with pioglitazone or CPA, where indicated, for 20 h, and relative luciferase activity was quantified. n = 4 for each condition; mean ± SD. *P < 0.05. F: mRNA profiles and representative Oil Red O staining of CGL MDMCs after the addition of MDI media with or without pioglitazone (10 nmol/L) after 12 days of differentiation. n = 4 for each condition; mean ± SD. nd, not determined. (A high-quality color representation of this figure is available in the online issue.)
FIG. 8.
FIG. 8.
Schematic representation of AGPAT2 regulation of adipogenesis. Schematic of proposed role of AGPAT2 in supporting adipocyte differentiation from normal individuals (A) and changes in people with CGL (B). See text for details.

Similar articles

Cited by

References

    1. Huang-Doran I, Sleigh A, Rochford JJ, O’Rahilly S, Savage DB. Lipodystrophy: metabolic insights from a rare disorder. J Endocrinol 2010;207:245–255 - PubMed
    1. Cao H, Alston L, Ruschman J, Hegele RA. Heterozygous CAV1 frameshift mutations (MIM 601047) in patients with atypical partial lipodystrophy and hypertriglyceridemia. Lipids Health Dis 2008;7:3. - PMC - PubMed
    1. Agarwal AK, Arioglu E, De Almeida S, et al. AGPAT2 is mutated in congenital generalized lipodystrophy linked to chromosome 9q34. Nat Genet 2002;31:21–23 - PubMed
    1. Miranda DM, Wajchenberg BL, Calsolari MR, et al. Novel mutations of the BSCL2 and AGPAT2 genes in 10 families with Berardinelli-Seip congenital generalized lipodystrophy syndrome. Clin Endocrinol (Oxf) 2009;71:512–517 - PubMed
    1. Leung DW. The structure and functions of human lysophosphatidic acid acyltransferases. Front Biosci 2001;6:D944–D953 - PubMed

Publication types

MeSH terms