

Level-dependent changes in perception of speech envelope cues
- PMID: 22872414
- PMCID: PMC3505593
- DOI: 10.1007/s10162-012-0343-2
Level-dependent changes in perception of speech envelope cues
Abstract
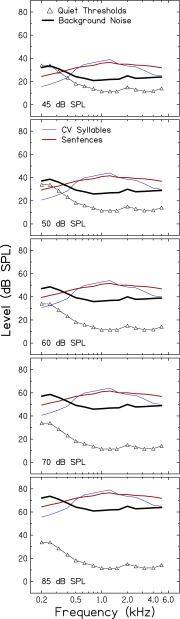
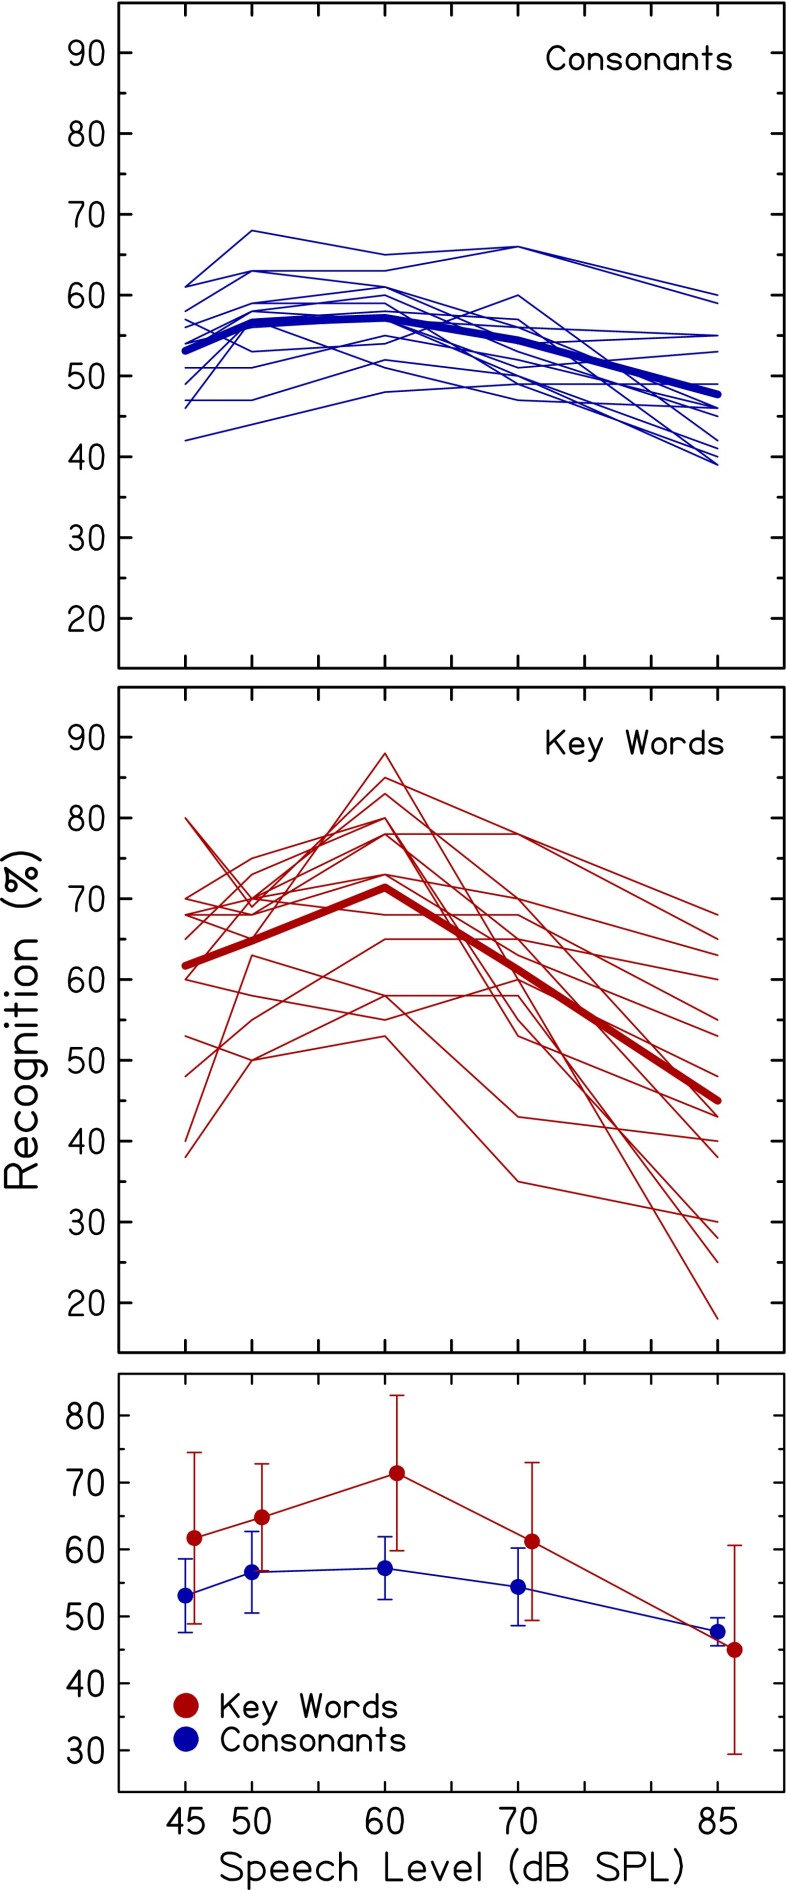
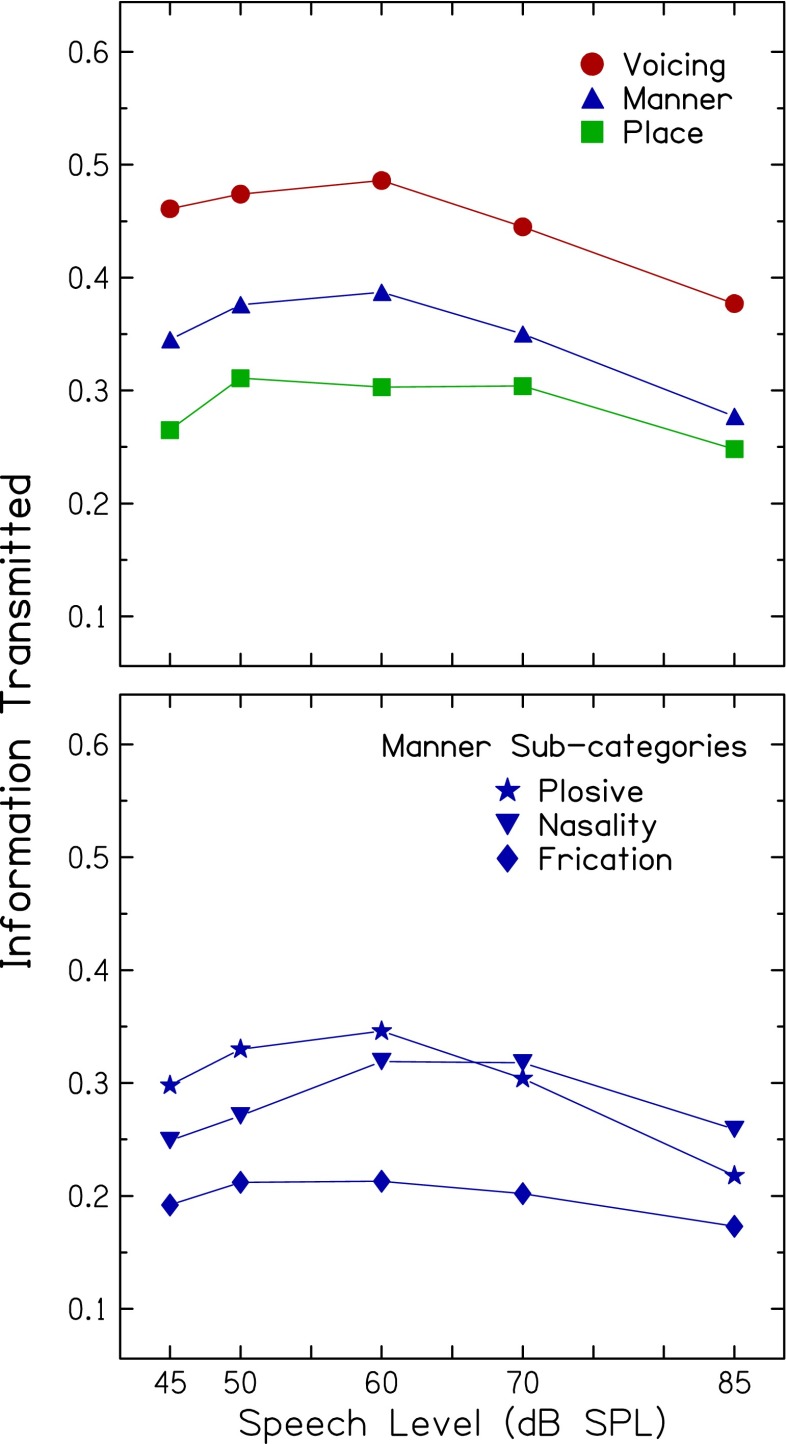
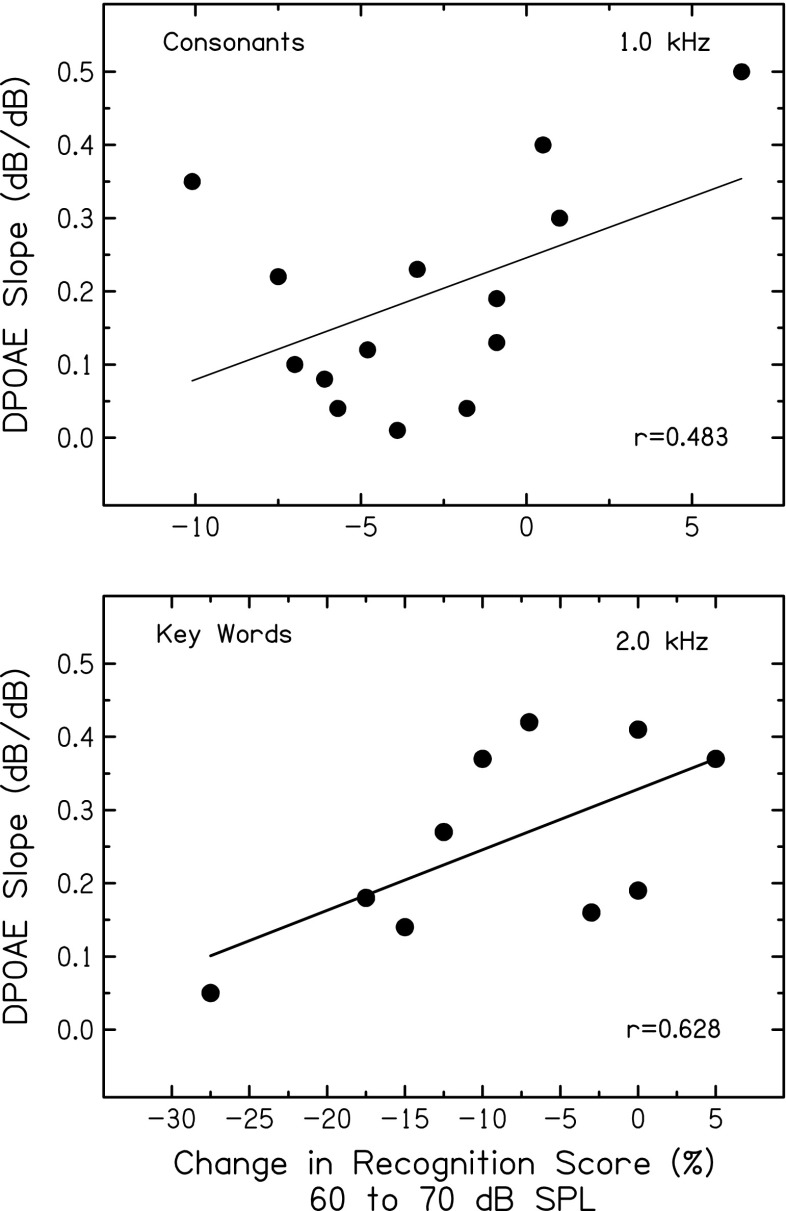
Level-dependent changes in temporal envelope fluctuations in speech and related changes in speech recognition may reveal effects of basilar-membrane nonlinearities. As a result of compression in the basilar-membrane response, the "effective" magnitude of envelope fluctuations may be reduced as speech level increases from lower level (more linear) to mid-level (more compressive) regions. With further increases to a more linear region, speech envelope fluctuations may become more pronounced. To assess these effects, recognition of consonants and key words in sentences was measured as a function of speech level for younger adults with normal hearing. Consonant-vowel syllables and sentences were spectrally degraded using "noise vocoder" processing to maximize perceptual effects of changes to the speech envelope. Broadband noise at a fixed signal-to-noise ratio maintained constant audibility as speech level increased. Results revealed significant increases in scores and envelope-dependent feature transmission from 45 to 60 dB SPL and decreasing scores and feature transmission from 60 to 85 dB SPL. This quadratic pattern, with speech recognition maximized at mid levels and poorer at lower and higher levels, is consistent with a role of cochlear nonlinearities in perception of speech envelope cues.
Figures
Similar articles
-
Speech recognition in noise: estimating effects of compressive nonlinearities in the basilar-membrane response.Ear Hear. 2007 Sep;28(5):682-93. doi: 10.1097/AUD.0b013e31812f7156. Ear Hear. 2007. PMID: 17804982
-
Estimates of basilar-membrane nonlinearity effects on masking of tones and speech.Ear Hear. 2007 Feb;28(1):2-17. doi: 10.1097/AUD.0b013e3180310212. Ear Hear. 2007. PMID: 17204895
-
Effects of Expanding Envelope Fluctuations on Consonant Perception in Hearing-Impaired Listeners.Trends Hear. 2018 Jan-Dec;22:2331216518775293. doi: 10.1177/2331216518775293. Trends Hear. 2018. PMID: 29756553 Free PMC article.
-
Effects of Threshold Adjustment on Speech Perception in Nucleus Cochlear Implant Recipients.Ear Hear. 2016 May-Jun;37(3):303-11. doi: 10.1097/AUD.0000000000000248. Ear Hear. 2016. PMID: 26671316
-
Temporal cues and the effect of their enhancement on speech perception in older adults - A scoping review.J Otol. 2016 Sep;11(3):95-101. doi: 10.1016/j.joto.2016.08.001. Epub 2016 Aug 27. J Otol. 2016. PMID: 29937817 Free PMC article.
Cited by
-
Compression and amplification algorithms in hearing aids impair the selectivity of neural responses to speech.Nat Biomed Eng. 2022 Jun;6(6):717-730. doi: 10.1038/s41551-021-00707-y. Epub 2021 May 3. Nat Biomed Eng. 2022. PMID: 33941898 Free PMC article.
-
Adaptation to Noise in Human Speech Recognition Unrelated to the Medial Olivocochlear Reflex.J Neurosci. 2018 Apr 25;38(17):4138-4145. doi: 10.1523/JNEUROSCI.0024-18.2018. Epub 2018 Mar 28. J Neurosci. 2018. PMID: 29593051 Free PMC article.
-
Recognition of spectrally shaped speech in speech-modulated noise: Effects of age, spectral shape, speech level, and vocoding.JASA Express Lett. 2023 Apr 1;3(4):044402. doi: 10.1121/10.0017772. JASA Express Lett. 2023. PMID: 37096892 Free PMC article.
-
Adaptation to Noise in Human Speech Recognition Depends on Noise-Level Statistics and Fast Dynamic-Range Compression.J Neurosci. 2020 Aug 19;40(34):6613-6623. doi: 10.1523/JNEUROSCI.0469-20.2020. Epub 2020 Jul 17. J Neurosci. 2020. PMID: 32680938 Free PMC article.
References
-
- American National Standards Institute (2004) Specification for audiometers. ANSI S3.6-2004, American National Standards Institute, New York
-
- Guidelines for manual pure-tone threshold audiometry. MD: American Speech-Language-Hearing Association; 2005.
-
- Bess FH, Josey AF, Humes LE. Performance-intensity functions in cochlear and eighth nerve disorders. Am J Otol. 1979;1:27–31. - PubMed
Publication types
MeSH terms
Grants and funding
LinkOut - more resources
Full Text Sources
Research Materials
Miscellaneous
