. 2012 Oct;153(10):5023-35.
doi: 10.1210/en.2012-1286. Epub 2012 Aug 7.

Filamin A is a regulator of blood-testis barrier assembly during postnatal development in the rat testis

Affiliations

Filamin A is a regulator of blood-testis barrier assembly during postnatal development in the rat testis

Wenhui Su et al. Endocrinology. 2012 Oct.

Abstract

The blood-testis barrier (BTB) is an important ultrastructure in the testis. A delay in its assembly during postnatal development leads to meiotic arrest. Also, a disruption of the BTB by toxicants in adult rats leads to a failure in spermatogonial differentiation. However, the regulation of BTB assembly remains unknown. Herein, filamin A, an actin filament cross-linker that is known to maintain and regulate cytoskeleton structure and function in other epithelia, was shown to be highly expressed during the assembly of Sertoli cell BTB in vitro and postnatal development of BTB in vivo, perhaps being used to maintain the actin filament network at the BTB. A knockdown of filamin A by RNA interference was found to partially perturb the Sertoli cell tight junction (TJ) permeability barrier both in vitro and in vivo. Interestingly, this down-regulating effect on the TJ barrier function after the knockdown of filamin A was associated with a mis-localization of both TJ and basal ectoplasmic specialization proteins. Filamin A knockdown also induced a disorganization of the actin filament network in Sertoli cells in vitro and in vivo. Collectively, these findings illustrate that filamin A regulates BTB assembly by recruiting these proteins to the microenvironment in the seminiferous epithelium to serve as the building blocks. In short, filamin A participates in BTB assembly by regulating protein recruitment during postnatal development in the rat testis.


Figures
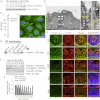
Fig. 1.
Fig. 1.
Expression and characterization of filamin A during the assembly of Sertoli cell BTB in vitro and in vivo. A, Immunoblot analysis of filamin A in lysates (30 μg protein) of Sertoli cells (SC) cultured in vitro with a functional TJ barrier established by approximately d 2–3. Actin served as a loading control. B, Electron micrographs of Sertoli cells cultured in vitro for 4 d with ultrastructures found at the BTB in vivo. Microvilli, which are typical features of Sertoli cells cultured in vitro, were visible in these cells (green arrowheads in Bi and Bii). Two adjacent Sertoli cells (SC) and the distinctive nucleus (Nu) with the specialized junctions annotated by apposing white arrowheads were seen (Bi). Gap junctions (blue arrowheads in Bii) and TJ (red arrowheads in Biii, illustrating the kisses between apposing Sertoli cells, see apposing white arrowheads) coexisted with basal ES (see yellow bracket), typified by the presence of actin filament bundles (yellow arrowheads in Bii and Biii) sandwiched between cisternae of endoplasmic reticulum (ER) and the apposing plasma membranes of two adjacent Sertoli cells (apposing white arrowheads), which together with desmosome (purple arrowheads, Bii) constitute the BTB. Scale bars, 2.5 μm (Bi); 0.2 μm (Bii), and 0.25 μm (Biii). C, Immunoblotting to illustrate the specificity of the anti-filamin A antibody using lysates of SC (Ci). This antibody was used to visualize filamin A (green) in Sertoli cells (0.05 × 10⁶ cells/cm2) cultured for 4 d. Nuclei were visualized with DAPI (blue) (Cii). Scale bar, 25 μm (Cii). D, Using co-IP, filamin A was found to structurally interact with JAM-A, but not occludin or β-catenin, using 500 μg protein lysates of Sertoli cells cultured for 4 d with an established TJ permeability barrier. Sertoli cell lysate (30 μg protein) alone without co-IP and co-IP using normal rabbit IgG to substitute for the precipitating antibody served as the corresponding positive and negative control, respectively. The findings shown here are representative data of an experiment that was repeated three times and yielded identical results. E, Immunoblot analysis of filamin A, β1-integrin, and vimentin using testis lysate (30 μg protein) from rats at different dpp, with actin serving as a protein loading control (Ei). The histogram summarizes results of Ei after each data point was normalized against actin. Protein levels at 12 dpp were arbitrarily set as 1 against which statistical comparison was performed (Eii). Each bar is a mean ± sd of n = 3 rats. **, P < 0.01. F, Colocalization of filamin A (green) and F-actin (red) in frozen sections of testes from rats at different ages. Nuclei were visualized with DAPI (blue). It was noted that the expression of filamin A and its colocalization with F-actin were considerably high at approximately 12–17 dpp at the time of BTB assembly but declined considerably by 20–30 dpp when the BTB was established (4). Scale bar in F, 25 μm, which applies to all micrographs in F.
Fig. 2.
Fig. 2.
Effects of cytokines and steroids on the cellular localization of filamin A vs. F-actin and vimentin in Sertoli cells cultured in vitro. Sertoli cells (0.05 × 10⁶ cells/cm2) were cultured alone for 4 d. Thereafter, cells were treated with TNFα (10 ng/ml), TGF-β3 (3 ng/ml), testosterone (2 × 10⁻⁷ m), or estradiol-17β (2 × 10⁻⁹ m) vs. controls for 48 h as shown in A–O. Cells were fixed and processed for immunofluorescence microscopy as described in Materials and Methods and stained for filamin A (green), F-actin (red), and vimentin (green). Nuclei were visualized with DAPI (blue). TNFα treatment led to an accumulation of filamin A in cytoplasm closer to cell nuclei (arrowheads in D), whereas testosterone treatment led to a more intense signal of filamin A at the cell cortex (arrowheads in J). Changes of F-actin were similar to filamin A in the same treatment group (arrowheads in E and K) vs. controls; however, vimentin in all groups were unaffected. Scale bar in A, 25 μm, which applies to micrographs in A–O.
Fig. 3.
Fig. 3.
Knockdown of filamin A by RNAi in Sertoli cell epithelium perturbs the TJ barrier function via changes in F-actin organization, protein distribution, and protein-protein interactions at the BTB. A, Sertoli cells (0.5 × 10⁶ cells/cm2) were cultured alone for 4 d; thereafter, cells were transfected on d 4 with specific filamin A (FLNa) siRNA vs. nontargeting control siRNA duplexes for 24 h. Cultures were terminated 72 h later to obtain lysates for immunoblotting. When filamin A was knocked down by approximately 70% (B), no off-target effect was detected when several BTB proteins were assessed by immunoblot analysis (see Supplemental Fig. 2). pERK, Phospho-ERK. B, Histogram based on immunoblot results of filamin A shown in A after normalizing the data against actin to illustrate the efficacy of RNAi. Filamin A level in the nontargeting control was arbitrarily set at 1. Bar is mean ± sd of two independent experiments, but three additional pilot experiments yielded similar results. **, P < 0.01. C, Effects of filamin A knockdown by RNAi on the Sertoli cell TJ barrier function was monitored by quantifying TER across the cell epithelium when Sertoli cells (1.2 × 10⁶ cells/cm2) were transfected with the corresponding siRNA duplexes on d 2 and 3 for 24 h, respectively, with a 12-h interval for recovery, at a final concentration of 150 nm. Filamin A silencing was found to perturb the Sertoli cell TJ barrier function. *, P < 0.05; **, P < 0.01. This experiment was repeated three times using different Sertoli cell preparations and yielded similar results. D, On d 3, Sertoli cells (0.05 × 10⁶ cells/cm2) were transfected with the corresponding siRNA duplexes for 24 h at a final concentration of 80 nm, together with 1 nm siGLO Red (Cy3), which served as a transfection indicator. Immunostaining of filamin A, F-actin, occludin, ZO-1, N-cadherin, and β-catenin (all in green) was performed on d 6 to investigate the effects of filamin A RNAi on protein distribution in Sertoli cells. Red staining surrounding nuclei indicates positive transfection. After transfection, the signal of filamin A was considerably declined in cells treated with filamin A-specific siRNA duplexes vs. control (Ctrl) groups. F-actin became less organized in treated cells vs. controls. A considerable change in protein distribution in occludin, ZO-1, and β-catenin, but not N-cadherin, at the cell-cell interface was detected after filamin A knockdown when these proteins moved from the cell surface into the cell cytosol. Scale bar in D, 25 μm, which applies to all micrographs. E, Co-IP was performed using Sertoli cell lysates (∼500 μg protein) after filamin A silencing vs. nontargeting control with an anti-N-cadherin antibody (see Table 2) as the precipitating antibody. The blots were probed with an anti-β-catenin to assess changes in protein-protein interactions between N-cadherin and β-catenin. Sertoli cell lysates without co-IP (∼35 μg protein) served as the positive control. F, Histogram summarizing co-IP results shown in C from n = 3 experiments. The protein-protein interactions in the nontargeting control group were arbitrarily set at 1. **, P < 0.01.
Fig. 4.
Fig. 4.
Effects of filamin A knockdown on BTB assembly during postnatal development in the rat testis. A, A schematic drawing illustrating the treatment regimen. Testes of rats (n = 3–4 rats for each termination time point in treatment vs. control groups) at age 18, 19, and 20 dpp received either nontargeting control or specific filamin A siRNA duplexes daily (in ∼10–12.5 μl per testis to a desired concentration of 100 nm siRNA duplexes, assuming the volume of the testis from rats at 18, 19, and 20 dpp to be 0.058, 0.072, and 0.085 ml, corresponding to a testis weight at 0.058, 0.072, and 0.085 g, respectively) with three consecutive doses. After treatment, in vivo BTB integrity assays were performed on 21, 25, 30, and 35 dpp in the treatment vs. the two control groups. For positive control, rats were treated with a single dose of CdCl2 (5 mg/kg BW, ip) without any siRNA duplexes and terminated 3 d later because CdCl2 is known to induce irreversible BTB damage in rats within 48 h (41). B, Localization of inulin-FITC (green) in sections of frozen testes after administration of the inulin-FITC via the jugular vein in the BTB integrity assay. BTB integrity was assessed by its ability to block the influx of inulin-FITC into the adluminal compartment from the basal compartment, which lay behind the BTB in the epithelium near the basement membrane as denoted by the white broken circle in a tubule. White brackets in the micrographs illustrate the distance of inulin-FITC diffused into the seminiferous epithelium from BTB. Representative damaged tubules after filamin A RNAi at different time points were shown. Scale bar in B, 25 μm, which applies to all micrographs. Ctrl, Control. C, Histogram illustrating semiquantitative BTB integrity assay data by comparing the distance traveled by inulin-FITC from the BTB (DSignal) vs. the radius of a tubule (DRadius) (for a tubule that was obliquely sectioned, tubule radius was obtained by averaging the shortest and the longest radius from the basement membrane). Each bar is mean ± sd of approximately 120–180 tubules that were randomly selected from three rat testes. **, P < 0.01. FLNa, Filamin A.
Fig. 5.
Fig. 5.
Changes in F-actin vs. filamin A organization in the seminiferous epithelium of rat testes during postnatal development after filamin A knockdown. A, Sections of control (Ctrl, treated with nontargeting siRNA duplexes) and filamin A-silenced testes from rats at specified ages (see Fig. 4A for the treatment regimen) were costained for filamin A (green) and F-actin (red) with cell nuclei visualized by DAPI (blue). In filamin A-silenced tubules, the signal of filamin A in the epithelium was considerably weakened vs. the corresponding control, which indicated an effective knockdown of filamin A in vivo. F-actin filaments were found to become disorganized, failed to form a continuous belt-like ultrastructure surrounding the seminiferous epithelium at the BTB in filamin A-silenced tubules (white arrowheads) vs. the corresponding control (yellow arrowheads), which was considerably more obvious on 21 and 25 dpp but became less obvious by 30 dpp and almost indistinguishable from control by 35 dpp. Scale bar, 15 μm, which applies to all micrographs. B, Imaging analysis of fluorescence signals of filamin A in the seminiferous epithelium of rat testes after filamin A knockdown in vivo. The histogram summarized findings shown in A by quantifying the fluorescence intensity of filamin A using ImageJ version 1.44I software package. At least 50 tubules were randomly selected from each testis and quantified. Each bar represents mean ± sd of n = 3 rats. **, P < 0.01.
Fig. 6.
Fig. 6.
The knockdown of filamin A (FLNa) by RNAi in the testis during postnatal development induces changes in the recruitment of TJ and basal ES proteins to the BTB. Sections of control (Ctrl, treated with nontargeting siRNA duplexes, panels a–d) and filamin A-silenced testes from rats (panels e–h) at specified ages (see Fig. 4A for the treatment regimen) were used for dual-labeled immunofluorescence analysis to colocalize TJ proteins [e.g. JAM-A (red) and ZO-1 (green)] in panel A or basal ES proteins [e.g. β-catenin (red) and N-cadherin (green)] in panel B at the BTB with cell nuclei visualized by DAPI (blue). The white broken ring indicates approximate location of the basement membrane in each tubule, which is adjacent to the BTB. In filamin A-silenced tubules, especially on 21 and 25 dpp (D), the signals of JAM-A (and ZO-1 in rats at 21 dpp) were found to be considerably mislocalized; instead of being recruited to the site of BTB, they were diffusely localized from the BTB (white brackets and white arrowheads in panel A) vs. the corresponding control. The signal of N-cadherin and β-catenin also became diffusely localized, in particular N-cadherin by 30 dpp in filamin A-silenced tubules vs. control (white arrowheads in panel B). It is noted that the changes depicted herein are rather uniform in all the tubules examined, because at age 21 and 25 dpp, stage-specific changes regarding the cellular composition of the tubules are not obvious. Even by age 35 dpp, only round spermatids were detected in the tubules without any condensing spermatids because elongating spermatids are not found in tubules until age 38 dpp in rats. Scale bar in panel Aa (21 dpp), 25 μm, which applies to for all micrographs at 21 and 25 dpp in panels A and B; scale bar in Aa (30 dpp), 50 μm, which applies to all micrographs at 30 and 35 dpp in panels A and B.

Similar articles

Cited by

References

    1. Clermont Y, Perry B. 1957. Quantitative study of the cell population of the seminiferous tubules in immature rats. J Anat 100:241–267 - PubMed
    1. Bergmann M, Dierichs R. 1983. Postnatal formation of the blood-testis barrier in the rat with special reference to the initiation of meiosis. Anat Embryol 168:269–275 - PubMed
    1. Vitale R, Fawcett DW, Dym M. 1973. The normal development of the blood-testis barrier and the effects of clomiphene and estrogen treatment. Anat Rec 176:331–344 - PubMed
    1. Mok KW, Mruk DD, Lee WM, Cheng CY. 2011. A study to assess the assembly of a functional blood-testis barrier in developing rat testes. Spermatogenesis 1:270–280 - PMC - PubMed
    1. Toyama Y, Ohkawa M, Oku R, Maekawa M, Yuasa S. 2001. Neonatally administered diethylstilbestrol retards the development of the blood-testis barrier in the rat. J Androl 22:413–423 - PubMed

Publication types

MeSH terms