Characterization of enzymes from Legionella pneumophila involved in reversible adenylylation of Rab1 protein
- PMID: 22872634
- PMCID: PMC3471704
- DOI: 10.1074/jbc.M112.396861
Characterization of enzymes from Legionella pneumophila involved in reversible adenylylation of Rab1 protein
Abstract
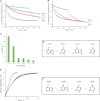
After the pathogenic bacterium Legionella pneumophila is phagocytosed, it injects more than 250 different proteins into the cytoplasm of host cells to evade lysosomal digestion and to replicate inside the host cell. Among these secreted proteins is the protein DrrA/SidM, which has been shown to modify Rab1b, a main regulator of vesicular trafficking in eukaryotic cells, by transfer of adenosine monophosphate (AMP) to Tyr(77). In addition, Legionella provides the protein SidD that hydrolytically reverses the covalent modification, suggesting a tight spatial and temporal control of Rab1 function by Legionella during infection. Small angle x-ray scattering experiments of DrrA allowed us to validate a tentative complex model built by combining available crystallographic data. We have established the effects of adenylylation on Rab1 interactions and properties in a quantitative way. In addition, we have characterized the kinetics of DrrA-catalyzed adenylylation as well as SidD-catalyzed deadenylylation toward Rab1 and have determined the nucleotide specificities of both enzymes. This study enhances our knowledge of proteins subverting Rab1 function at the Legionella-containing vacuole.
Figures


Similar articles
-
Rab1-AMPylation by Legionella DrrA is allosterically activated by Rab1.Nat Commun. 2021 Jan 19;12(1):460. doi: 10.1038/s41467-020-20702-2. Nat Commun. 2021. PMID: 33469029 Free PMC article.
-
Legionella pneumophila SidD is a deAMPylase that modifies Rab1.Nature. 2011 Jul 6;475(7357):506-9. doi: 10.1038/nature10307. Nature. 2011. PMID: 21734656 Free PMC article.
-
Rab1 guanine nucleotide exchange factor SidM is a major phosphatidylinositol 4-phosphate-binding effector protein of Legionella pneumophila.J Biol Chem. 2009 Feb 20;284(8):4846-56. doi: 10.1074/jbc.M807505200. Epub 2008 Dec 17. J Biol Chem. 2009. PMID: 19095644 Free PMC article.
-
De-AMPylation unmasked: modulation of host membrane trafficking.Sci Signal. 2011 Oct 11;4(194):pe42. doi: 10.1126/scisignal.2002458. Sci Signal. 2011. PMID: 21990428 Review.
-
Evolution and function of bacterial RCC1 repeat effectors.Cell Microbiol. 2020 Oct;22(10):e13246. doi: 10.1111/cmi.13246. Epub 2020 Aug 26. Cell Microbiol. 2020. PMID: 32720355 Review.
Cited by
-
Rab1-AMPylation by Legionella DrrA is allosterically activated by Rab1.Nat Commun. 2021 Jan 19;12(1):460. doi: 10.1038/s41467-020-20702-2. Nat Commun. 2021. PMID: 33469029 Free PMC article.
-
AMPylation is critical for Rab1 localization to vacuoles containing Legionella pneumophila.mBio. 2014 Feb 11;5(1):e01035-13. doi: 10.1128/mBio.01035-13. mBio. 2014. PMID: 24520063 Free PMC article.
-
AMPylation of small GTPases by Fic enzymes.FEBS Lett. 2023 Mar;597(6):883-891. doi: 10.1002/1873-3468.14516. Epub 2022 Oct 27. FEBS Lett. 2023. PMID: 36239538 Free PMC article. Review.
-
Directing Traffic: Regulation of COPI Transport by Post-translational Modifications.Front Cell Dev Biol. 2019 Sep 11;7:190. doi: 10.3389/fcell.2019.00190. eCollection 2019. Front Cell Dev Biol. 2019. PMID: 31572722 Free PMC article. Review.
-
Invited review: Small GTPases and their GAPs.Biopolymers. 2016 Aug;105(8):431-48. doi: 10.1002/bip.22833. Biopolymers. 2016. PMID: 26972107 Free PMC article. Review.
References
Publication types
MeSH terms
Substances
LinkOut - more resources
Full Text Sources
Medical

