. 2012 Nov 15;21(22):4876-87.
doi: 10.1093/hmg/dds324. Epub 2012 Aug 7.

Impaired proteolysis underlies autophagic dysfunction in Niemann-Pick type C disease

Affiliations

Impaired proteolysis underlies autophagic dysfunction in Niemann-Pick type C disease

Matthew J Elrick et al. Hum Mol Genet. .

Abstract

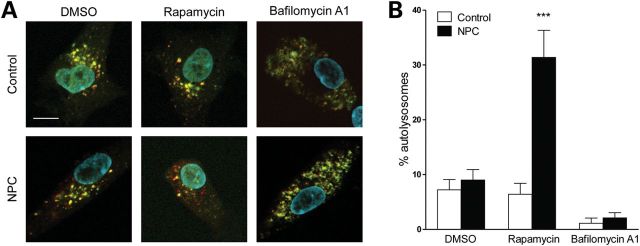
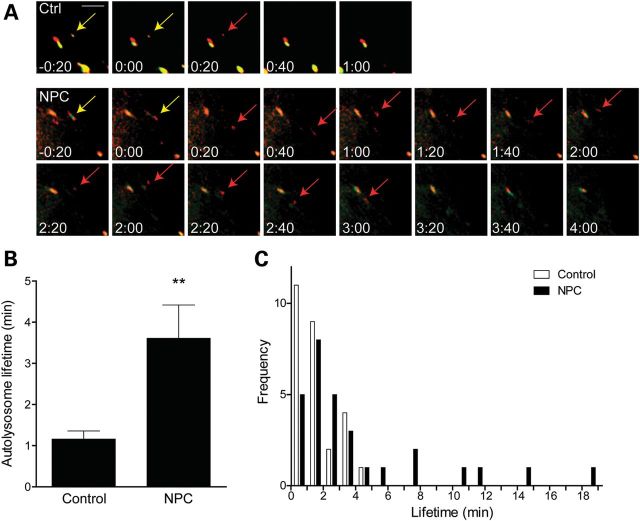
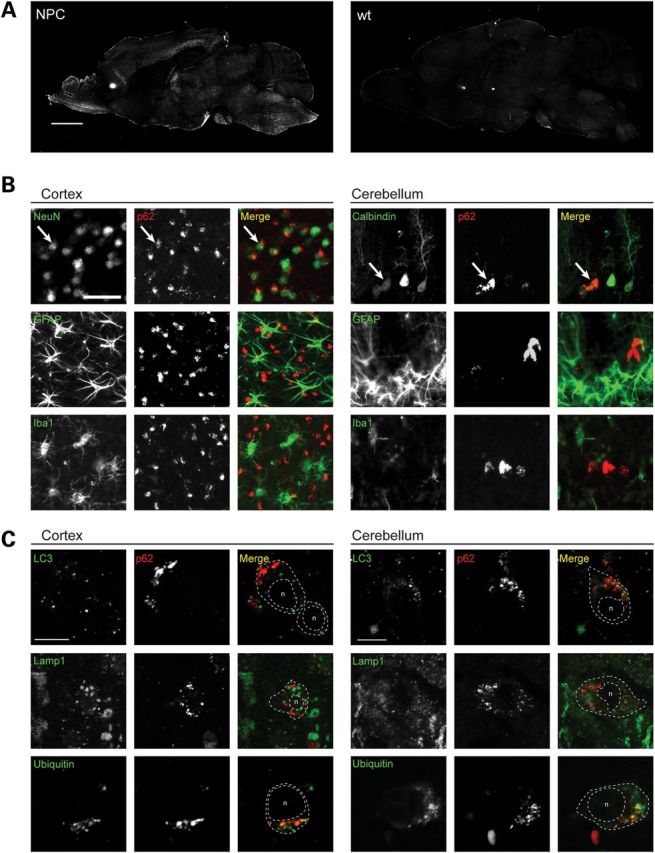
Niemann-Pick type C disease (NPC) is a childhood onset neurodegenerative disorder arising from lipid-trafficking defects caused by mutations in the NPC1 or NPC2 gene. Marked accumulation of autophagosomes is a prominent feature of NPC cells, yet a detailed understanding of the disease-associated alterations in autophagy and their role in pathogenesis has been lacking. Prior studies have shown that lipid storage in NPC disease induces autophagy. Here, we additionally show that the clearance of autophagosomes in NPC1 deficiency is impaired due to inhibition of lysosomal protease activity by stored lipids. We also demonstrate that the autophagic pathway is a source of stored cholesterol in the NPC lysosome, thus creating a positive feedback loop wherein autophagy induction exacerbates the disease via increased lipid storage. Inhibition of autophagy reduces cholesterol storage and restores normal lysosomal proteolysis in NPC1-deficient cells, supporting a model in which activation of the autophagic pathway promotes disease pathogenesis.


Figures

Figure 1.
Figure 1.
Intact autophagosome–lysosome fusion, but impaired autolysosome clearance in NPC1-deficient cells. (A) Representative images of human dermal fibroblasts transfected with mCherry-GFP-LC3, followed by 24 h treatment with vehicle (DMSO), 1 µm rapamycin, or 100 nm bafilomycin A1. Bafilomycin A1 treatment was included as a negative control, as it neutralizes the pH of lysosomes. Scale bar, 10 µm. (B) Quantification of the percent of total puncta that are autolysosomes (i.e. red only). n = 8–10 cells per group, pooled from two independent experiments. ***P < 0.001. Error bars are SEM.
Figure 2.
Figure 2.
Prolonged lifespan of autolysosomes in NPC1-deficient cells. (A) Representative live cell time lapse images from human dermal fibroblasts demonstrating the fusion of an autophagosome (yellow) with a lysosome to form an autolysosome (red), followed by maturation of the autolysosome, as indicated by the loss of red signal. Note that autophagosomes move within the field during the experiment. Arrow indicates location and color of the autophagosome being measured. Scale bar, 2 µm. (B) Average lifetime of autolysosomes. n = 27 (Control) or 29 (NPC1) fusion events from four independent experiments. (C) Histogram of data presented in D. **P < 0.01. Error bars are SEM.
Figure 3.
Figure 3.
Lipid storage inhibits lysosomal proteolysis. (A) Representative time lapse images of human dermal fibroblasts treated with Magic Red Cathepsin B substrate. Scale bar, 50 µm. (B) Fluorescence intensity, normalized to total lysosomal area, from one representative experiment. (C) Relative cathepsin B activity, as determined by the slope of the fluorescence intensity plots. n = 7–9 fields of cells per group, from three independent experiments. (D) Western blot for cathepsin B in human dermal fibroblast lysates, following 24 h treatment with 300 µm cyclodextrin or vehicle (water). Procathepsin B was undetectable in both cell lines, except at very long exposures (data not shown). (E) Lysosomal pH, measured by ratiometric imaging following uptake of Oregon Green dextran. Standard curve is shown in black. Extrapolated data points are shown in blue (control) and red (NPC). n = 34–92 cells for points on standard curve, 181 cells for Control, 141 cells for NPC. (F) Relative cathepsin B activity measured following 24 h treatment with 300 µm cyclodextrin or vehicle. n = 9 fields of cells per group, from three independent experiments. ***P < 0.001. Error bars are SEM.
Figure 4.
Figure 4.
PI3 kinase inhibitors rescue cathepsin activity. (A) Relative cathepsin B activity following 72 h treatment with 250 nm wortmannin or DMSO. n = 9 fields of cells per group, from three independent experiments. (B) Relative cathepsin B activity following 72 h treatment of NPC1-deficient fibroblasts with 20 um LY294002 or DMSO. n = 3 fields of cells per group. (C) Representative images from the experiment quantified in (A). Scale bar, 30 µm.*P < 0.05, ***P < 0.001. Error bars are SEM.
Figure 5.
Figure 5.
Autophagy contributes to lipid storage in NPC1-deficient cells. (A) Human dermal fibroblasts were treated with 1 µm rapamycin or vehicle (DMSO) for 24 h. Lipids were then extracted and total cellular unesterified cholesterol content was measured by HPTLC. n = 8 plates of cells per group, pooled across three independent experiments. (B) Summary of HPTLC data for total cellular content of cholesterol, glucosylceramide, lactosylceramide and globotriaosylceramide following treatment with 1 µm rapamycin or vehicle (DMSO) for 24 h. “Storage” is defined as the difference in absolute lipid content between NPC cells and DMSO-treated wild-type cells. For ease of comparison, data are normalized such that the relative storage of each lipid in DMSO-treated NPC cells equals one. GlcCer, galactosyl ceramide; LacCer, lactosyl ceramide; Gb3, globotriaosylceramide. (C) Human dermal fibroblasts were treated with DMSO, 1 µm rapamycin, or 250 nm wortmannin for 24 h. Stored cholesterol was stained with filipin, and the intensity of filipin staining was quantified by image analysis. n = 15 fields of cells, pooled across three independent experiments. (D) NPC1-deficient human dermal fibroblasts were treated with LY294002 at the indicated concentrations, or with vehicle (DMSO) for 72 h. Cholesterol storage was analyzed by filipin staining and image analysis. n = 20 fields of cells from two independent experiments. *P < 0.05, ***P < 0.001. (E) Wild-type or Atg5−/− MEFs were treated with 1 µg/ml U18666A or vehicle (ethanol) for 24 h and then stained with filipin to demonstrate cholesterol storage. (Left panel) Representative images of filipin staining in U18666A-treated MEFs. Scale bar, 50 µm. (Right panel) Quantification of filipin intensity across three independent experiments, n = 12–15 fields of cells per group in total. Error bars are SEM.
Figure 6.
Figure 6.
Autophagic substrate p62 accumulates in neurons in vivo. (A) Immunofluorescent staining for p62 in Npc1−/− or wild-type mouse brain. Scale bar, 2 mm. (B) Co-immunofluorescent staining for p62 (red) or markers (green) of neurons (NeuN, neuronal nuclei; or calbindin, Purkinje cells), astrocytes (GFAP) or microglia (Iba1) in Npc1−/− mice. Arrows indicate examples of a cell positive for both a neuronal marker and p62. Scale bar, 50 µm. (C) Confocal microscopy for colocalization of p62 (red) and autophagosomes (LC3), late endosomes and lysosomes (Lamp1) or ubiquitinated proteins (green). Dotted lines denote plasma membrane and nucleus (n). Scale bars, 10 µm.
Figure 7.
Figure 7.
Model for the role of autophagy in NPC1 disease. Stored cholesterol arrives at the lysosome by two routes: receptor-mediated endocytosis of LDL-cholesterol and autophagic delivery of cholesterol. Lipid storage has two simultaneous effects on the autophagic pathway. First, it induces autophagy through a Beclin1-dependent (18). Second, it inhibits lysosomal cathepsins, leading to impaired degradation of lysosomal cargoes. The results of these events are increased rate of autophagosome generation, mildly increased autophagic flux and an accumulation of autophagic intermediates. Further, because autophagy delivers cholesterol to the lysosome, a positive feedback loop is created that promotes further lipid storage and lysosomal dysfunction.

Similar articles

Cited by

References

    1. Klionsky D.J. The molecular machinery of autophagy: unanswered questions. J. Cell Sci. 2005;118:7–18. - PMC - PubMed
    1. Levine B., Kroemer G. Autophagy in the pathogenesis of disease. Cell. 2008;132:27–42. - PMC - PubMed
    1. Hara T., Nakamura K., Matsui M., Yamamoto A., Nakahara Y., Suzuki-Migishima R., Yokoyama M., Mishima K., Saito I., Okano H., et al. Suppression of basal autophagy in neural cells causes neurodegenerative disease in mice. Nature. 2006;441:885–889. - PubMed
    1. Komatsu M., Waguri S., Chiba T., Murata S., Iwata J., Tanida I., Ueno T., Koike M., Uchiyama Y., Kominami E., et al. Loss of autophagy in the central nervous system causes neurodegeneration in mice. Nature. 2006;441:880–884. - PubMed
    1. Ravikumar B., Vacher C., Berger Z., Davies J.E., Luo S., Oroz L.G., Scaravilli F., Easton D.F., Duden R., O'Kane C.J., et al. Inhibition of mTOR induces autophagy and reduces toxicity of polyglutamine expansions in fly and mouse models of Huntington disease. Nat. Genet. 2004;36:585–595. - PubMed

Publication types

MeSH terms