

Sustained H(2) production driven by photosynthetic water splitting in a unicellular cyanobacterium
- PMID: 22872781
- PMCID: PMC3419522
- DOI: 10.1128/mBio.00197-12
Sustained H(2) production driven by photosynthetic water splitting in a unicellular cyanobacterium
Abstract
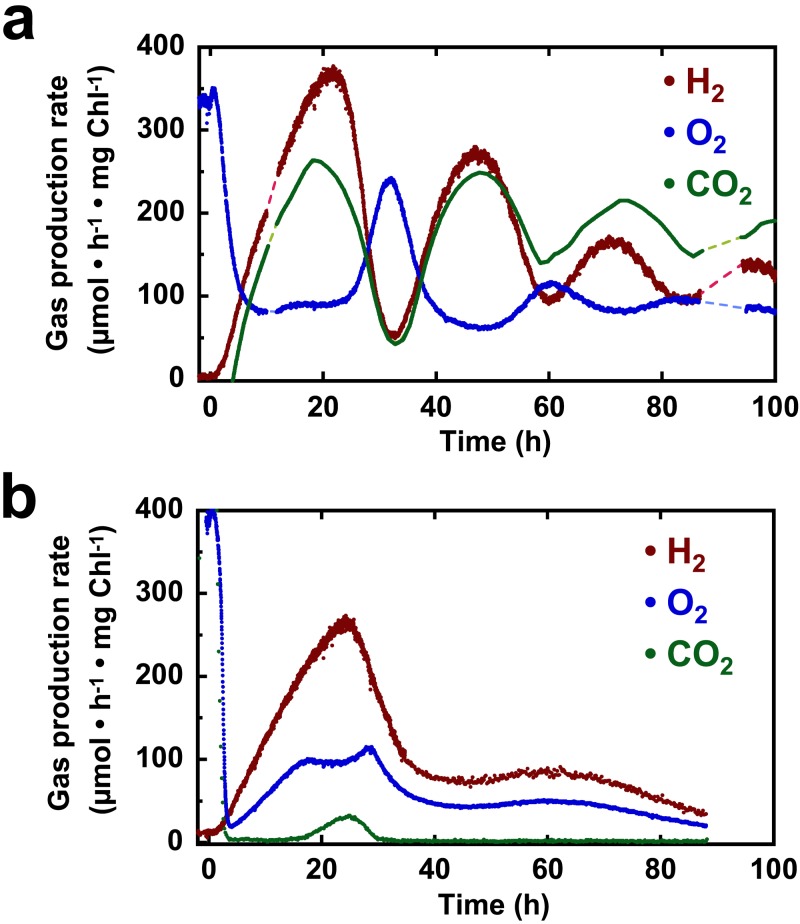
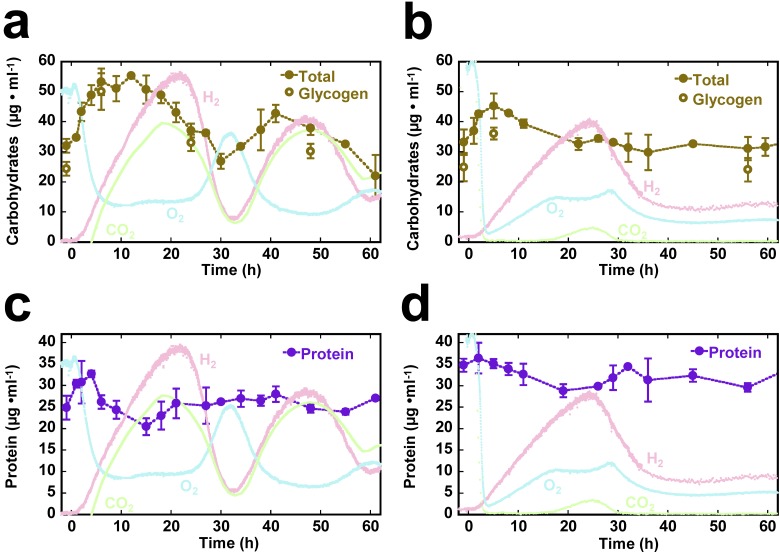
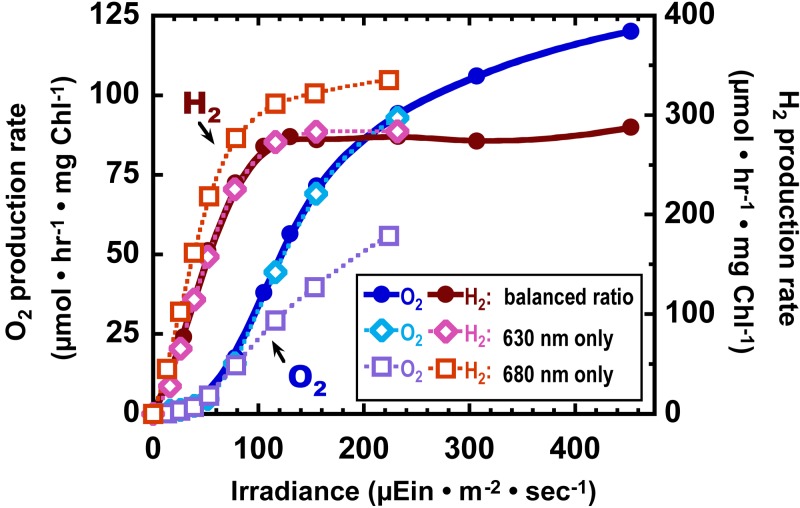
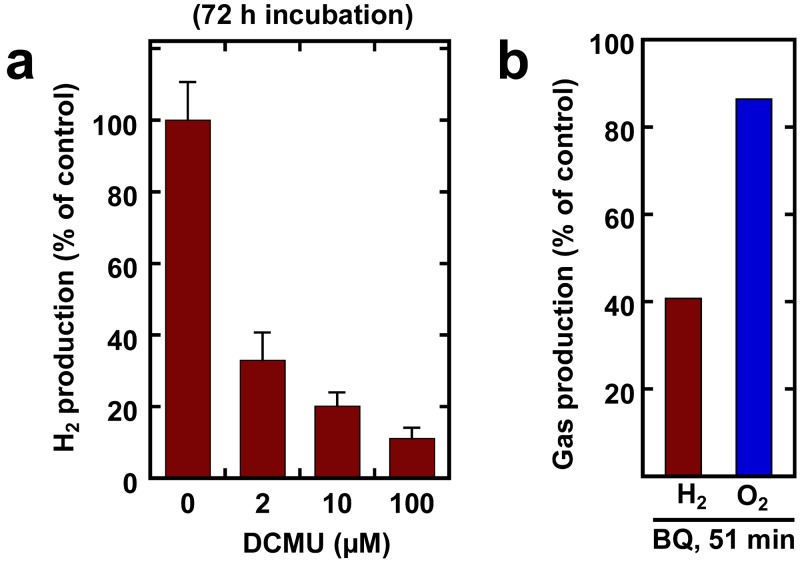
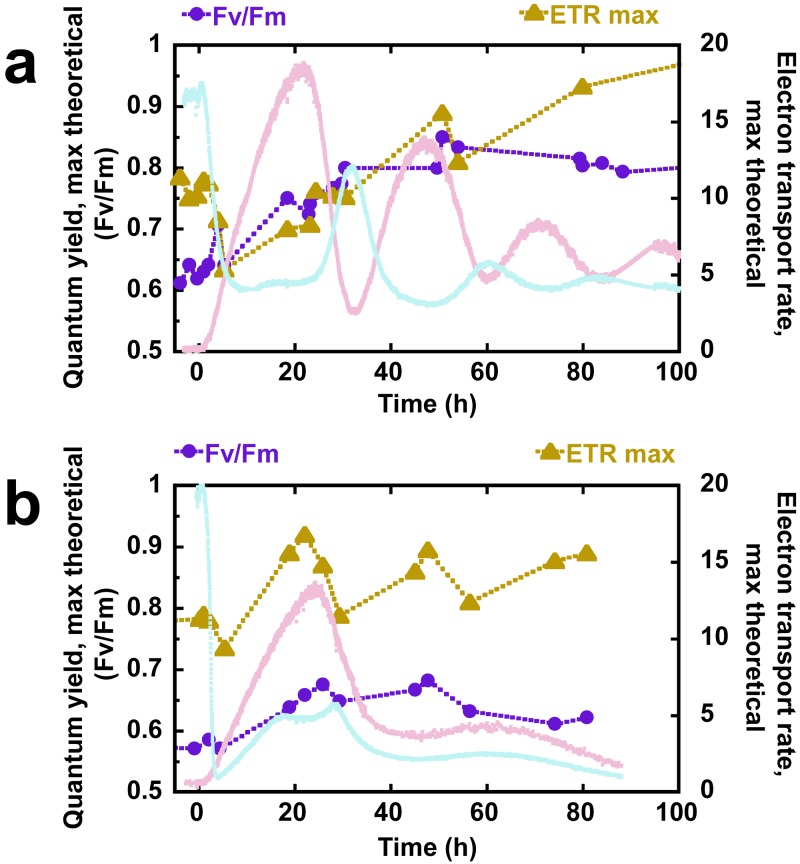
The relationship between dinitrogenase-driven H(2) production and oxygenic photosynthesis was investigated in a unicellular cyanobacterium, Cyanothece sp. ATCC 51142, using a novel custom-built photobioreactor equipped with advanced process control. Continuously illuminated nitrogen-deprived cells evolved H(2) at rates up to 400 µmol ⋅ mg Chl(-1) ⋅ h(-1) in parallel with uninterrupted photosynthetic O(2) production. Notably, sustained coproduction of H(2) and O(2) occurred over 100 h in the presence of CO(2), with both gases displaying inverse oscillations which eventually dampened toward stable rates of 125 and 90 µmol ⋅ mg Chl(-1) ⋅ h(-1), respectively. Oscillations were not observed when CO(2) was omitted, and instead H(2) and O(2) evolution rates were positively correlated. The sustainability of the process was further supported by stable chlorophyll content, maintenance of baseline protein and carbohydrate levels, and an enhanced capacity for linear electron transport as measured by chlorophyll fluorescence throughout the experiment. In situ light saturation analyses of H(2) production displayed a strong dose dependence and lack of O(2) inhibition. Inactivation of photosystem II had substantial long-term effects but did not affect short-term H(2) production, indicating that the process is also supported by photosystem I activity and oxidation of endogenous glycogen. However, mass balance calculations suggest that carbohydrate consumption in the light may, at best, account for no more than 50% of the reductant required for the corresponding H(2) production over that period. Collectively, our results demonstrate that uninterrupted H(2) production in unicellular cyanobacteria can be fueled by water photolysis without the detrimental effects of O(2) and have important implications for sustainable production of biofuels.
Importance: The study provides an important insight into the photophysiology of light-driven H(2) production by the nitrogen-fixing cyanobacterium Cyanothece sp. strain ATCC 51142. This work is also of significance for biotechnology, supporting the feasibility of "direct biophotolysis." The sustainability of the process, highlighted by prolonged gas evolution with no clear sign of significant decay or apparent photodamage, provides a foundation for the future development of an effective, renewable, and economically efficient bio-H(2) production process.
Figures
Similar articles
-
Multi-Omic Dynamics Associate Oxygenic Photosynthesis with Nitrogenase-Mediated H2 Production in Cyanothece sp. ATCC 51142.Sci Rep. 2015 Nov 3;5:16004. doi: 10.1038/srep16004. Sci Rep. 2015. PMID: 26525576 Free PMC article.
-
Coupling of Cellular Processes and Their Coordinated Oscillations under Continuous Light in Cyanothece sp. ATCC 51142, a Diazotrophic Unicellular Cyanobacterium.PLoS One. 2015 May 14;10(5):e0125148. doi: 10.1371/journal.pone.0125148. eCollection 2015. PLoS One. 2015. PMID: 25973856 Free PMC article.
-
Enhanced Nitrogen Fixation in a glgX-Deficient Strain of Cyanothece sp. Strain ATCC 51142, a Unicellular Nitrogen-Fixing Cyanobacterium.Appl Environ Microbiol. 2019 Mar 22;85(7):e02887-18. doi: 10.1128/AEM.02887-18. Print 2019 Apr 1. Appl Environ Microbiol. 2019. PMID: 30709817 Free PMC article.
-
Constitution and energetics of photosystem I and photosystem II in the chlorophyll d-dominated cyanobacterium Acaryochloris marina.J Photochem Photobiol B. 2011 Jul-Aug;104(1-2):333-40. doi: 10.1016/j.jphotobiol.2011.02.017. Epub 2011 Feb 23. J Photochem Photobiol B. 2011. PMID: 21530298 Review.
-
Limiting factors in the operation of photosystems I and II in cyanobacteria.Microb Biotechnol. 2024 Aug;17(8):e14519. doi: 10.1111/1751-7915.14519. Microb Biotechnol. 2024. PMID: 39101352 Free PMC article. Review.
Cited by
-
Tiny Microbes with a Big Impact: The Role of Cyanobacteria and Their Metabolites in Shaping Our Future.Mar Drugs. 2016 May 17;14(5):97. doi: 10.3390/md14050097. Mar Drugs. 2016. PMID: 27196915 Free PMC article. Review.
-
Biohydrogen production: strategies to improve process efficiency through microbial routes.Int J Mol Sci. 2015 Apr 14;16(4):8266-93. doi: 10.3390/ijms16048266. Int J Mol Sci. 2015. PMID: 25874756 Free PMC article. Review.
-
Dinitrogenase-Driven Photobiological Hydrogen Production Combats Oxidative Stress in Cyanothece sp. Strain ATCC 51142.Appl Environ Microbiol. 2016 Nov 21;82(24):7227-7235. doi: 10.1128/AEM.02098-16. Print 2016 Dec 15. Appl Environ Microbiol. 2016. PMID: 27742679 Free PMC article.
-
Unlocking the Constraints of Cyanobacterial Productivity: Acclimations Enabling Ultrafast Growth.mBio. 2016 Jul 26;7(4):e00949-16. doi: 10.1128/mBio.00949-16. mBio. 2016. PMID: 27460798 Free PMC article.
-
Rapid construction of metabolic models for a family of Cyanobacteria using a multiple source annotation workflow.BMC Syst Biol. 2013 Dec 27;7:142. doi: 10.1186/1752-0509-7-142. BMC Syst Biol. 2013. PMID: 24369854 Free PMC article.
References
-
- Romagnoli F, Blumberga D, Pilicka I. 2011. Life cycle assessment of biohydrogen production in photosynthetic processes. Int. J. Hydrogen Energ. 36:7866–7871
-
- Ghirardi ML, Mohanty P. 2010. Oxygenic hydrogen photoproduction—current status of the technology. Curr. Sci. 98:499–507
-
- McKinlay JB, Harwood CS. 2010. Photobiological production of hydrogen gas as a biofuel. Curr. Opin. Biotechnol. 21:244–251 - PubMed
-
- Vignais PM, Billoud B. 2007. Occurrence, classification, and biological function of hydrogenases: an overview. Chem. Rev. 107:4206–4272 - PubMed
Publication types
MeSH terms
Substances
LinkOut - more resources
Full Text Sources
Miscellaneous
