. 2012 Sep 11;109(37):14989-94.
doi: 10.1073/pnas.1211138109. Epub 2012 Aug 7.

Prolonged persistence of measles virus RNA is characteristic of primary infection dynamics

Affiliations

Prolonged persistence of measles virus RNA is characteristic of primary infection dynamics

Wen-Hsuan W Lin et al. Proc Natl Acad Sci U S A. .

Abstract

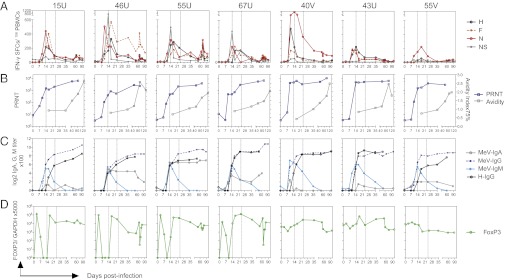
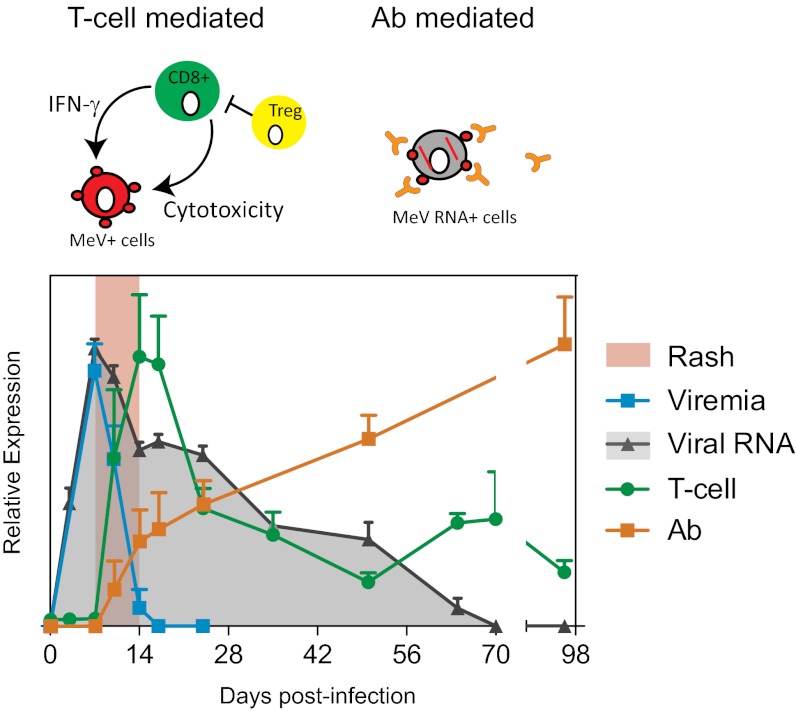
Measles virus (MeV) is the poster child for acute infection followed by lifelong immunity. However, recent work shows the presence of MeV RNA in multiple sites for up to 3 mo after infection in a proportion of infected children. Here, we use experimental infection of rhesus macaques to show that prolonged RNA presence is characteristic of primary infection. We found that viral RNA persisted in the blood, respiratory tract, or lymph nodes four to five times longer than the infectious virus and that the clearance of MeV RNA from blood happened in three phases: rapid decline coincident with clearance of infectious virus, a rebound phase with increases up to 10-fold, and a phase of slow decrease to undetectable levels. To examine the effect of individual host immune factors on MeV load dynamics further, we developed a mathematical model that expressed viral replication and elimination in terms of the strength of MeV-specific T-cell responses, antibody responses, target cell limitations, and immunosuppressive activity of regulatory T cells. Based on the model, we demonstrate that viral dynamics, although initially regulated by T cells, require antibody to eliminate viral RNA. These results have profound consequences for our view of acute viral infections, the development of prolonged immunity, and, potentially, viral evolution.


Conflict of interest statement

The authors declare no conflict of interest.

Figures

Fig. 1.
Fig. 1.
Prolonged presence of MeV RNA in multiple sites after infection. (A) Infectious virus in the blood detected by cocultivation of PBMCs with susceptible cells. Results converted to tissue culture 50% infectious doses (TCID50) are shown as number of infected cells per 106 PBMCs (red lines). The MeV RNA load was measured by N-specific qRT-PCR using RNA extracted from 2 × 10⁶ PBMCs. Points with undetectable MeV RNA are plotted with open circles. Lines mark 14 and 24 d after infection. Macaques are identified at the top of individual graphs. (B) Presence of MeV RNA in the respiratory tract determined by N-specific RT-PCR on RNA extracted from nasal swab cell pellets. RT-PCR products run on gels were read as positive or negative (Table S2). Results are plotted as the percentage of animals with detection of MeV RNA. (C) MeV RNA loads in lymph nodes (LN) were determined by N-specific qRT-PCR. Inguinal lymph nodes from three macaques were biopsied 71 d after infection. n.d., not detected.
Fig. 2.
Fig. 2.
MeV-specific cellular and humoral immune responses during the course of infection. (A) MeV-specific T-cell responses were assessed by IFN-γ ELISpot assays. Numbers of specific spot-forming cells (SFCs) were calculated by subtracting nonspecific (NS) responses. Data are plotted as the means of the duplicates from each condition. Macaques are identified at the top of individual graphs. (B) Reciprocal titers of neutralizing antibody in plasma were determined by PRN titer (PRNT). Results were calculated from assay triplicates. Avidity of MeV-specific IgG was assessed by disruption of antibody binding with 0–3.5 M NH4SCN and calculation of avidity index 75%, indicating the concentration needed to remove 75% of bound antibody. (C) MeV-specific IgG, IgM, and IgA in the plasma were measured by EIAs using plates coated with a lysate from MeV-infected Vero cells. H-specific IgG was measured using plates coated with a lysate from MeV H-expressing L cells. Antibody titers were determined based on the OD values of serially diluted plasma and assay-specific background. (D) FoxP3 expression as an indicator of the induction of Tregs was determined by qRT-PCR using RNA extracted from PBMCs.
Fig. 3.
Fig. 3.
Mathematical models for the process of within-host clearance of MeV RNA. (A) Diagram of the linear model. The virus load was directly modulated by different immune components. V(t) denotes the virus load at time t, R(t) the abundance of target cells (lymphocyte concentration), T(t) the abundance of MeV-specific IFN-γ–producing T cells, A(t) the abundance of MeV-specific antibodies (PRN titer), and S(t) the immunosuppressive activity (FoxP3 mRNA). (B) Models were fitted by maximum likelihood to the virus load data (see Materials and Methods). Colors indicate different versions of the model. The T cell-AB-FoxP3 model (Eq. 1; blue line) takes T cells, antibodies, and FoxP3 into account; the T cell-AB model (green line) takes only T cells and antibodies into account; and the T-cell model (red line) takes only T cells into account. The models are fitted for each animal individually (fits in which all parameters except 1 are common between animals are provided in Fig. S9). Log-likelihood from the different models is shown in right upper quadrants with colors corresponding to lines. The observed MeV RNA load is shown in open circles. Gray vertical lines mark the estimated lowest detection level of the qRT-PCR assay at given time points. Macaques are identified at the top of individual graphs.
Fig. 4.
Fig. 4.
Rash, viral dynamics, and T-cell and antibody dynamics. Results of viremia, viral RNA, MeV-specific IFN-γ production, and PRN titer are plotted as the average from the study macaques + SEM. T-cell response data (green) are calculated as the sum of the H-, F-, and N-specific IFN-γ responses and plotted on a linear scale of 0–800 spot-forming cells per 106 PBMCs. Antibody response data from PRNT (orange) are plotted on a linear scale of 0–8,000 reciprocal titer. Viremia (cyan) and viral RNA (gray) are plotted in a logarithmic scale with an axis of 0–5 log tissue culture 50% infectious dose per 106 PBMCs or 0–105 MeV/GAPDH × 5,000. Based on the mathematical models, we show that viral dynamics, although initially regulated by T cells, require antibody to eliminate viral RNA.

Comment in

  • Measles immunometrics.
    Pierson TC, Yewdell JW. Pierson TC, et al. Proc Natl Acad Sci U S A. 2012 Sep 11;109(37):14724-5. doi: 10.1073/pnas.1212243109. Epub 2012 Aug 30. Proc Natl Acad Sci U S A. 2012. PMID: 22936050 Free PMC article. No abstract available.

References

    1. Simons E, et al. Assessment of the 2010 global measles mortality reduction goal: Results from a model of surveillance data. Lancet. 2012;379:2173–2178. - PubMed
    1. Panum P. Observations made during the epidemic of measles on the Faroe Islands in the year 1846. Med Classics. 1938;3:829–886.
    1. Anderson RM, May RM. Infectious Diseases of Humans: Dynamics and Control. Oxford: Oxford Science Publications; 1992.
    1. Bjornstad ON. Dynamics of measles epidemics: Estimating scaling of transmission rates using a time series SIR model. Ecol Monogr. 2002;72(2):169–184.
    1. Grenfell BT. Dynamics of measles epidemics: Scaling noise, determinism, and predictability with the TSIR model. Ecol Monogr. 2002;72(2):185–202.

Publication types