

Laminar analysis of visually evoked activity in the primary visual cortex
- PMID: 22872866
- PMCID: PMC3427063
- DOI: 10.1073/pnas.1201478109
Laminar analysis of visually evoked activity in the primary visual cortex
Abstract
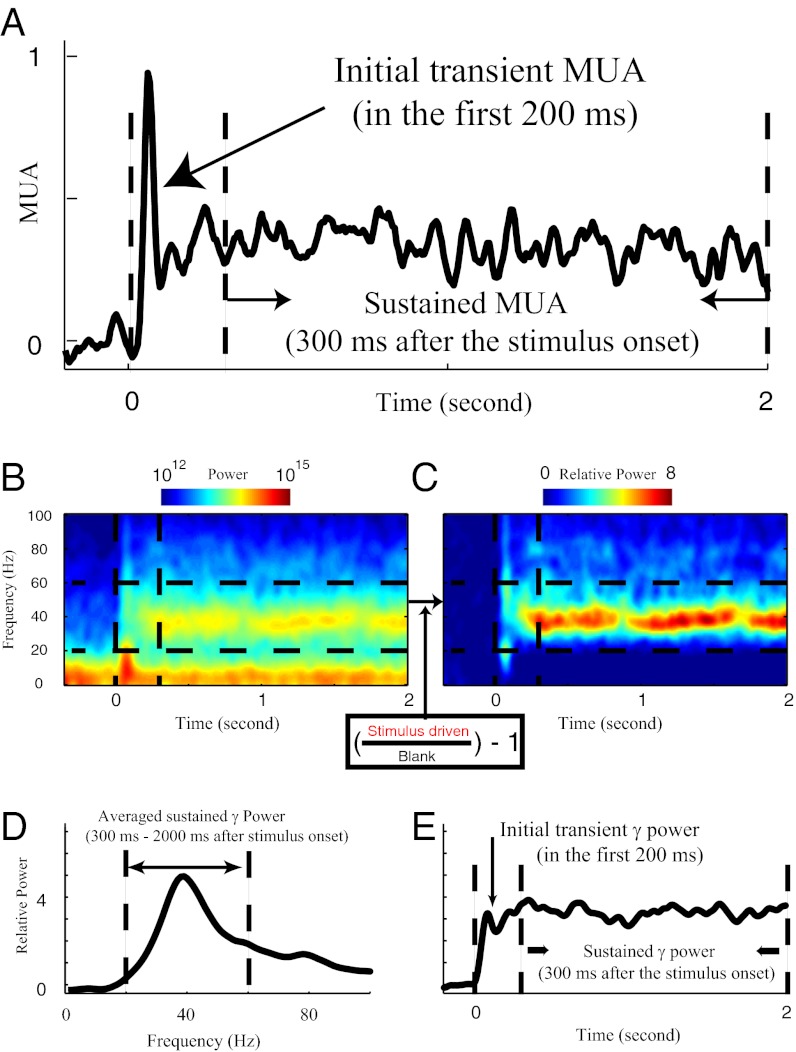
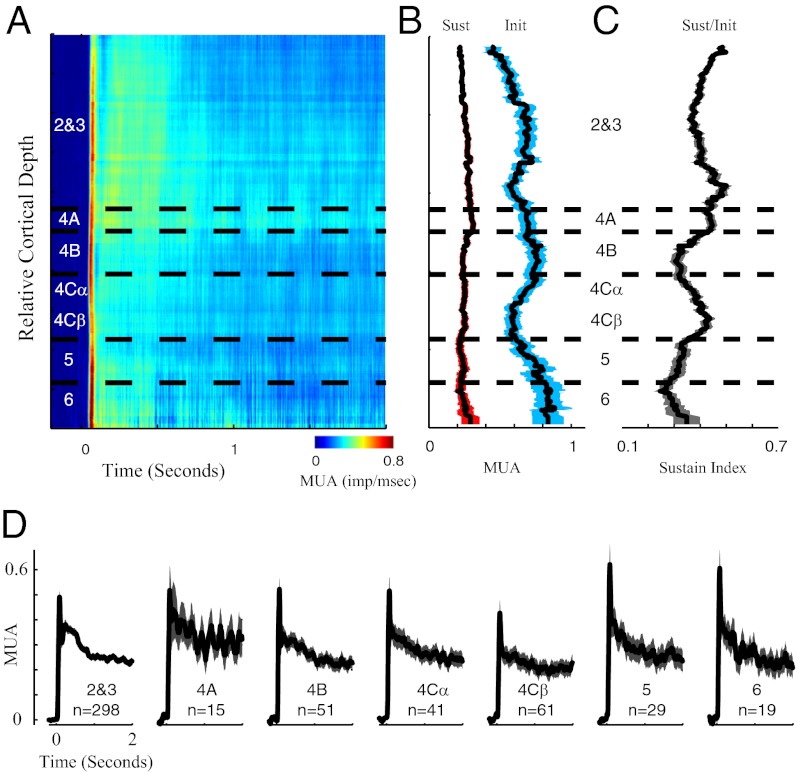
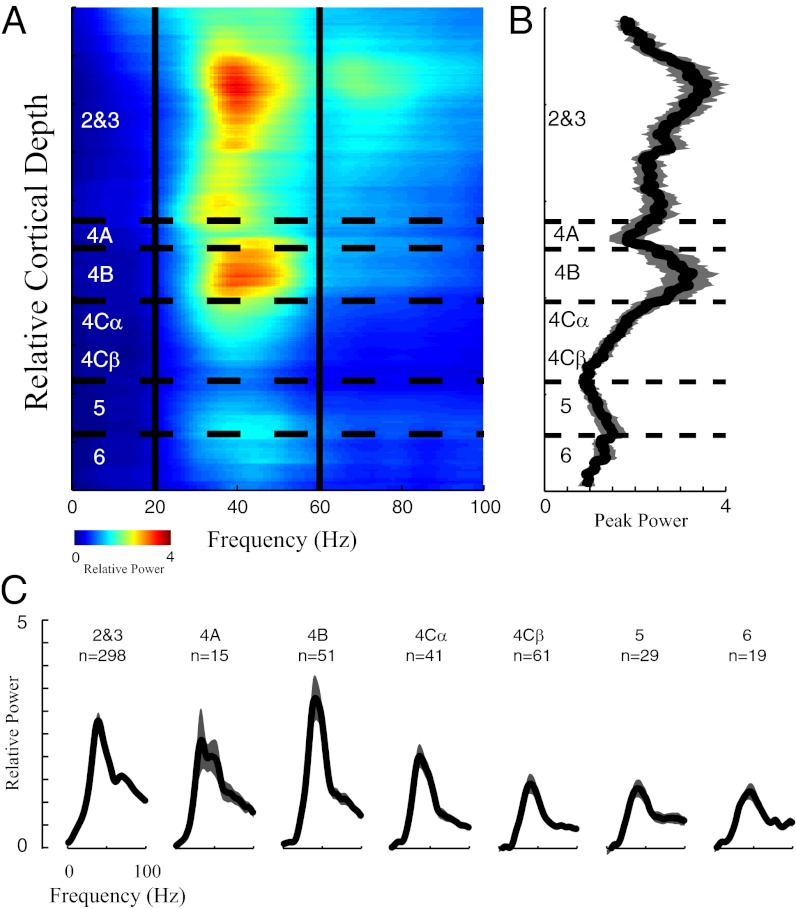
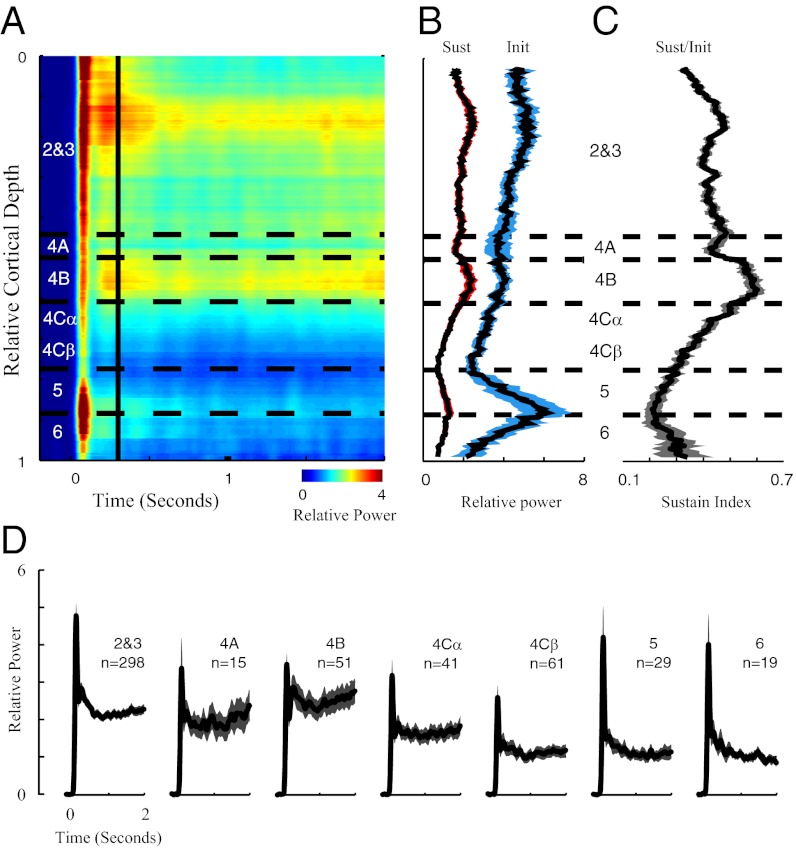
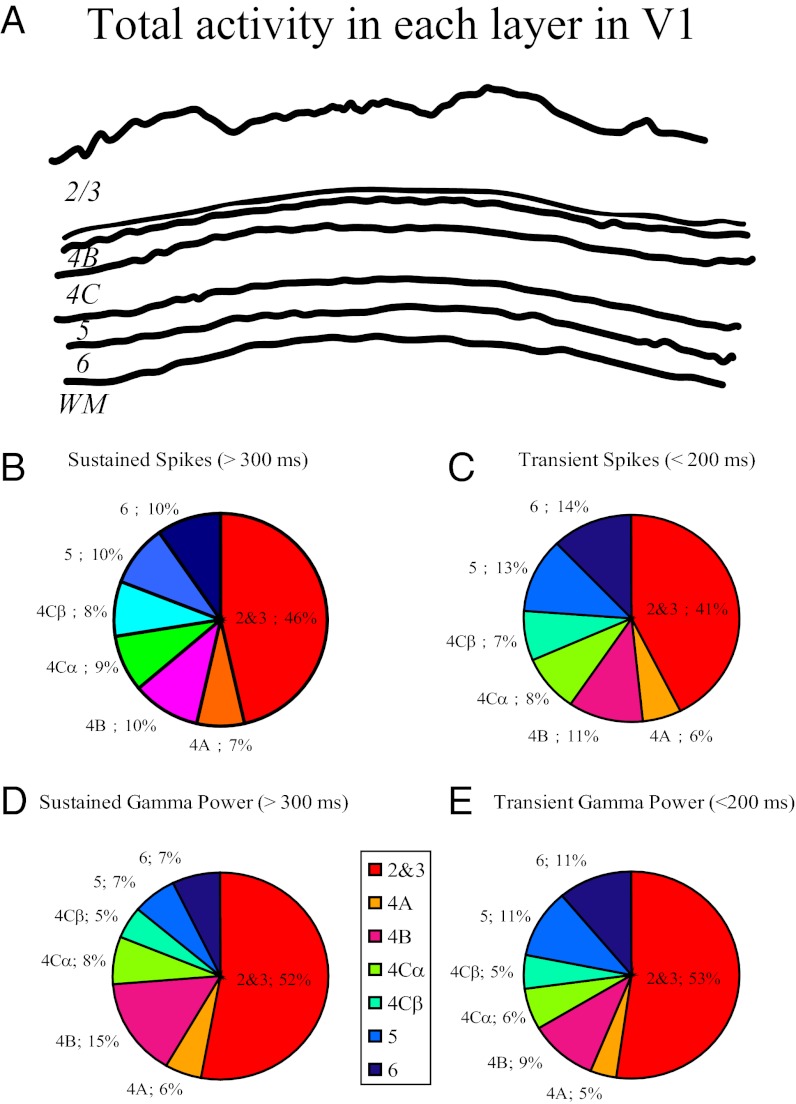
Studying the laminar pattern of neural activity is crucial for understanding the processing of neural signals in the cerebral cortex. We measured neural population activity [multiunit spike activity (MUA) and local field potential, LFP] in Macaque primary visual cortex (V1) in response to drifting grating stimuli. Sustained visually driven MUA was at an approximately constant level across cortical depth in V1. However, sustained, visually driven, local field potential power, which was concentrated in the γ-band (20-60 Hz), was greatest at the cortical depth corresponding to cortico-cortical output layers 2, 3, and 4B. γ-band power also tends to be more sustained in the output layers. Overall, cortico-cortical output layers accounted for 67% of total γ-band activity in V1, whereas 56% of total spikes evoked by drifting gratings were from layers 2, 3, and 4B. The high-resolution layer specificity of γ-band power, the laminar distribution of MUA and γ-band activity, and their dynamics imply that neural activity in V1 is generated by laminar-specific mechanisms. In particular, visual responses of MUA and γ-band activity in cortico-cortical output layers 2, 3, and 4B seem to be strongly influenced by laminar-specific recurrent circuitry and/or feedback.
Conflict of interest statement
The authors declare no conflict of interest.
Figures
Similar articles
-
Cortical brightness adaptation when darkness and brightness produce different dynamical states in the visual cortex.Proc Natl Acad Sci U S A. 2014 Jan 21;111(3):1210-5. doi: 10.1073/pnas.1314690111. Epub 2014 Jan 7. Proc Natl Acad Sci U S A. 2014. PMID: 24398523 Free PMC article.
-
Comparisons of the dynamics of local field potential and multiunit activity signals in macaque visual cortex.J Neurosci. 2010 Oct 13;30(41):13739-49. doi: 10.1523/JNEUROSCI.0743-10.2010. J Neurosci. 2010. PMID: 20943914 Free PMC article.
-
LFP power spectra in V1 cortex: the graded effect of stimulus contrast.J Neurophysiol. 2005 Jul;94(1):479-90. doi: 10.1152/jn.00919.2004. Epub 2005 Feb 9. J Neurophysiol. 2005. PMID: 15703230
-
Spike-Gamma Phase Relationship in the Visual Cortex.Annu Rev Vis Sci. 2022 Sep 15;8:361-381. doi: 10.1146/annurev-vision-100419-104530. Epub 2022 Jun 6. Annu Rev Vis Sci. 2022. PMID: 35667158 Review.
-
Gamma rhythms in the visual cortex: functions and mechanisms.Cogn Neurodyn. 2022 Aug;16(4):745-756. doi: 10.1007/s11571-021-09767-x. Epub 2021 Dec 22. Cogn Neurodyn. 2022. PMID: 35847544 Free PMC article. Review.
Cited by
-
Cortical depth profiles of luminance contrast responses in human V1 and V2 using 7 T fMRI.Hum Brain Mapp. 2018 Jul;39(7):2812-2827. doi: 10.1002/hbm.24042. Epub 2018 Mar 25. Hum Brain Mapp. 2018. PMID: 29575494 Free PMC article.
-
Cortical brightness adaptation when darkness and brightness produce different dynamical states in the visual cortex.Proc Natl Acad Sci U S A. 2014 Jan 21;111(3):1210-5. doi: 10.1073/pnas.1314690111. Epub 2014 Jan 7. Proc Natl Acad Sci U S A. 2014. PMID: 24398523 Free PMC article.
-
Sensory-driven and spontaneous gamma oscillations engage distinct cortical circuitry.J Neurophysiol. 2016 Apr;115(4):1821-35. doi: 10.1152/jn.00137.2015. Epub 2015 Dec 30. J Neurophysiol. 2016. PMID: 26719085 Free PMC article.
-
Prospective motion correction improves the sensitivity of fMRI pattern decoding.Hum Brain Mapp. 2018 Oct;39(10):4018-4031. doi: 10.1002/hbm.24228. Epub 2018 Jun 8. Hum Brain Mapp. 2018. PMID: 29885014 Free PMC article.
-
Spatial spread of local field potential is band-pass in the primary visual cortex.J Neurophysiol. 2016 Oct 1;116(4):1986-1999. doi: 10.1152/jn.00443.2016. Epub 2016 Aug 3. J Neurophysiol. 2016. PMID: 27489369 Free PMC article.
References
-
- Callaway EM. Local circuits in primary visual cortex of the macaque monkey. Annu Rev Neurosci. 1998;21:47–74. - PubMed
-
- Lund JS. Anatomical organization of macaque monkey striate visual cortex. Annu Rev Neurosci. 1988;11:253–288. - PubMed
-
- Mitzdorf U. Properties of the evoked potential generators: Current source-density analysis of visually evoked potentials in the cat cortex. Int J Neurosci. 1987;33:33–59. - PubMed
-
- Schroeder CE, Mehta AD, Givre SJ. A spatiotemporal profile of visual system activation revealed by current source density analysis in the awake macaque. Cereb Cortex. 1998;8:575–592. - PubMed
Publication types
MeSH terms
Grants and funding
LinkOut - more resources
Full Text Sources
