. 2012 Aug 8:5:14.
doi: 10.1186/2046-1682-5-14.

Molecular dynamics simulations on aqueous two-phase systems - Single PEG-molecules in solution

Affiliations

Molecular dynamics simulations on aqueous two-phase systems - Single PEG-molecules in solution

Stefan A Oelmeier et al. BMC Biophys. .

Abstract

Background: Molecular Dynamics (MD) simulations are a promising tool to generate molecular understanding of processes related to the purification of proteins. Polyethylene glycols (PEG) of various length are commonly used in the production and purification of proteins. The molecular mechanisms behind PEG driven precipitation, aqueous two-phase formation or the effects of PEGylation are however still poorly understood.

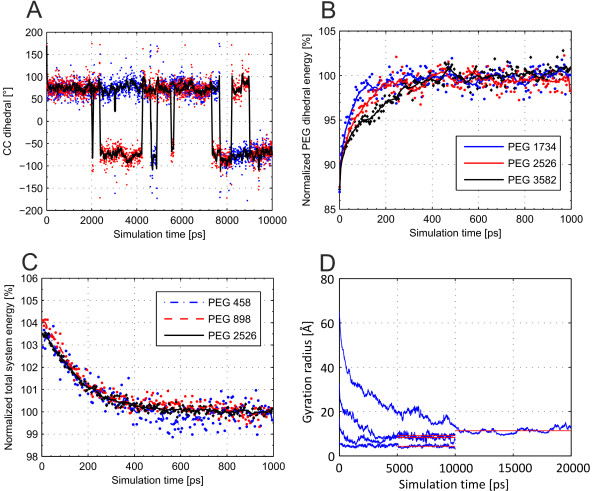
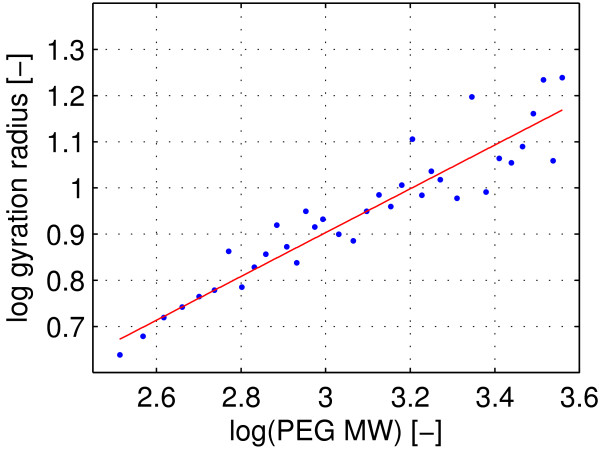
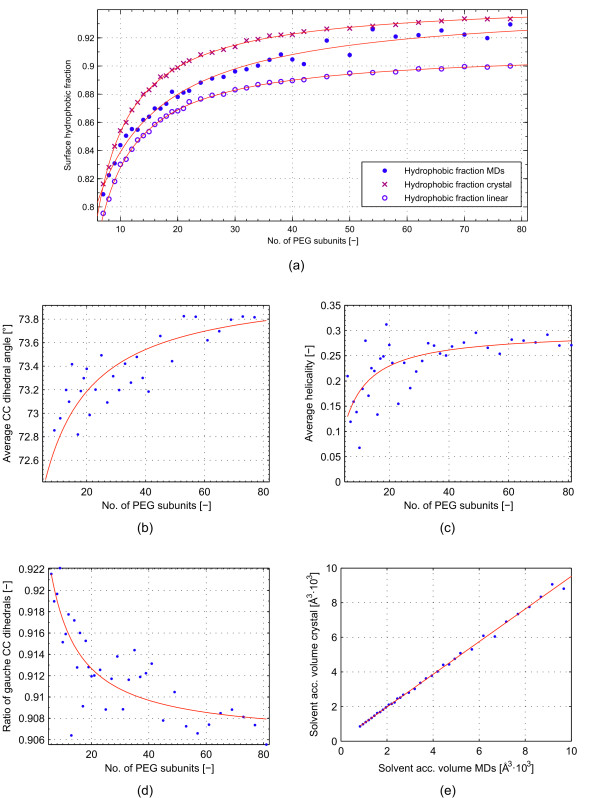
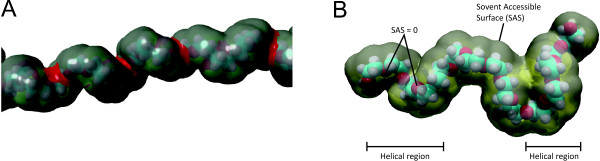
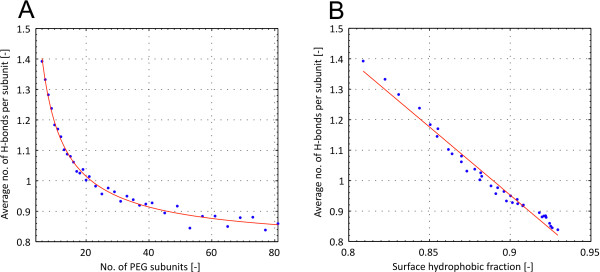
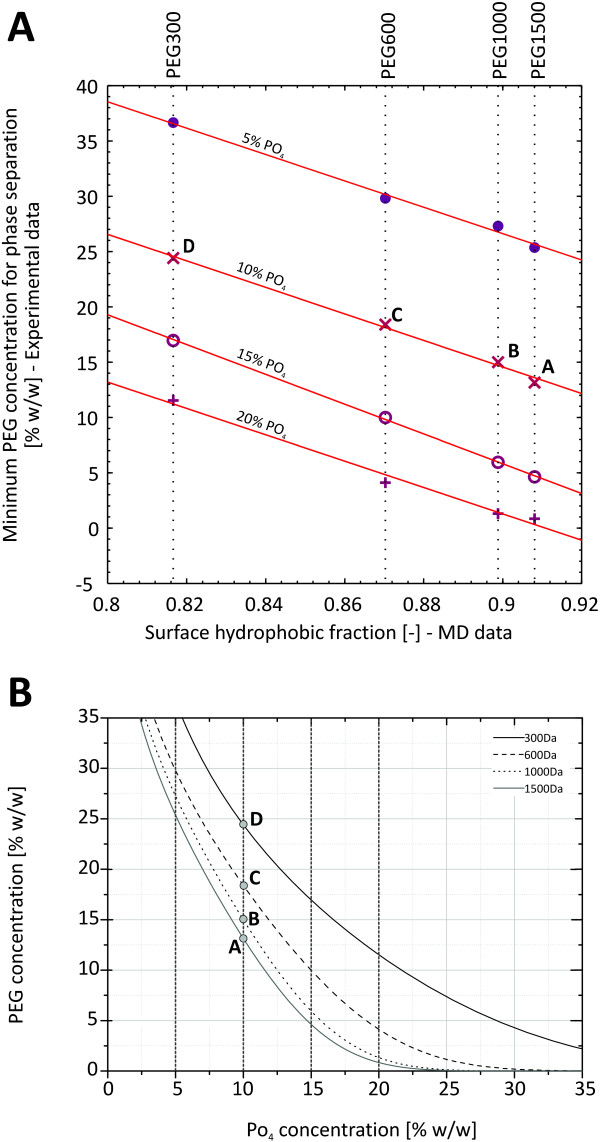
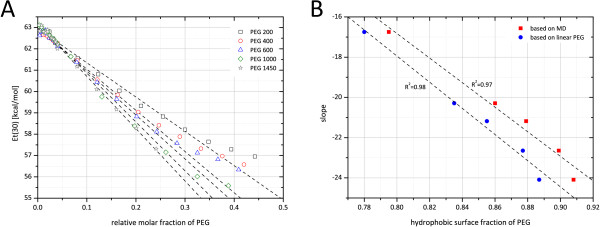
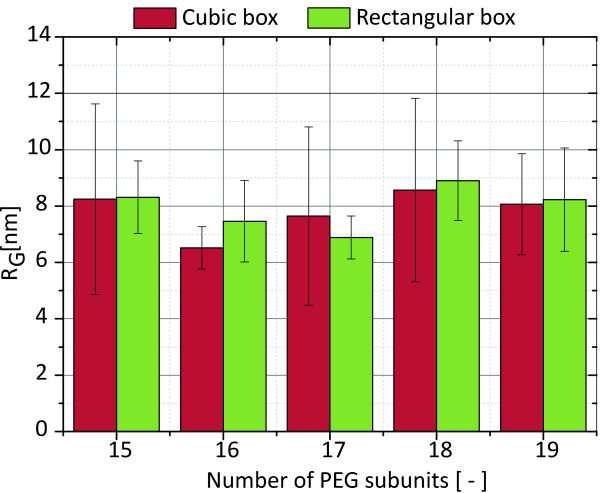
Results: In this paper, we ran MD simulations of single PEG molecules of variable length in explicitly simulated water. The resulting structures are in good agreement with experimentally determined 3D structures of PEG. The increase in surface hydrophobicity of PEG of longer chain length could be explained on an atomic scale. PEG-water interactions as well as aqueous two-phase formation in the presence of PO4 were found to be correlated to PEG surface hydrophobicity.

Conclusions: We were able to show that the taken MD simulation approach is capable of generating both structural data as well as molecule descriptors in agreement with experimental data. Thus, we are confident of having a good in silico representation of PEG.


Figures

Figure 1
Figure 1
Structural Dynamics during simulation. Structural dynamics resulting from the MD simulation. (a): Two dihedral angles of a PEG1162 over simulation time. (b): Dihedral energy of three selected PEGs over simulation time. (c): System total energy over simulation time. Single data points as well as smoothed line calculated over 9 data points are shown. The number of subunits are given in the legends. (d): Radius of gyration over simulation time. Blue lines show raw data of (from top to bottom) PEG2746, PEG1426, PEG766, and PEG326. Red lines show the timespan over which average properties of the polymer molecule were calculated
Figure 2
Figure 2
Gyration radius over PEG molecular weight. Dots: log RGplotted over log PEGMW. Line: Linear fit using least average square algorithm. The slope of the linear fit is not significantly different from 0.5
Figure 3
Figure 3
Surface hydrophobicity and structural attributes.(a): Surface hydrophobic fraction of artificially constructed perfectly helical, perfectly linear PEGs and results of the MD simulations over PEG chain length. (b)-(d): factors influencing surface hydrophobicity over PEG chain length with (b): CC dihedral angle, (c): helicality, (d): ratio of CC dihedrals in gauche conformations. (e) solvent accessible volumes of the PEG molecules determined from MD simulations over the corresponding volume of perfectly helical molecules
Figure 4
Figure 4
3D renderings of the resulting structures.(a): 3D rendering of a helical region formed during the MD simulation. CH-surfaces are marked gray, O-surfaces are marked red. (b): 3D rendering of a simulation snapshot of a PEG722 including the solvent accessible surface (1.4Å probe radius). Two oxygen atoms having near 0 solvent accessible surface as well as the helical regions are pointed out
Figure 5
Figure 5
Relationship between surface hydrophobicity and H-bonding. Average number of H-bonds per subunits over number of subunits (top) and surface hydrophobic fraction (bottom)
Figure 6
Figure 6
Relationship between surface hydrophobicity and two phase formation. Experimentally determined PEG concentration needed for two-phase formation of four different PEG molecular weights at four concentrations of PO4 plotted over the surface hydrophobic fraction of the corresponding PEG molecules determined from MD simulations. Phase formation in the presence: ●5% PO4, ×10% PO4, ∘15% PO4, + 20% PO4. B: Experimentally determined binodals of PEG-PO4 ATPSystems. Dashed lines represent the levels of PO4 concentration at which the minimum concentration of PEG needed for phase separation was determined. The data point labeled “A”, “B”, “C”, and “D” are the same points on the binodals in both subfigures
Figure 7
Figure 7
Relationship between surface hydrophobicity and solvent polarity.A:ET(30)values of solutions of PEG of varying molecular weight plotted over the relative mole fraction of PEG calculated as described in the section “Polarity measurements”. The slopes of the linear parts of the plots were used as measure for the polarity of PEG. B: The slopes as determined in subfigure A plotted over the surface hydrophobicity calculated from MD simulation results of the corresponding PEG molecules
Figure 8
Figure 8
Comparison of the radius of gyration resulting from a cubic box to the radius of gyration resulting from a rectangular box. A subset of PEG simulations was run both in a rectangular and in a cubic box. The resulting average radii of gyration fall well within the standard deviations (shown as error bars) of one another

Similar articles

Cited by

References

    1. Atha DH, Ingham KC. Mechanism of precipitation of proteins by polyethylene glycols. Analysis in terms of excluded volume. J biol Chem. 1981;256(2323):12108–17. - PubMed
    1. Shulgin IL, Ruckenstein E. Preferential hydration and solubility of proteins in aqueous solutions of polyethylene glycol. Biophys chem. 2006;120(3):188–98. doi: 10.1016/j.bpc.2005.11.010. - DOI - PubMed
    1. Albertsson PÅ. Particle fractionation in liquid two-phase systems The composition of some phase systems and the behavior of some model particles in them application to the isolation of cell walls from microorganisms. Biochim Biophys Acta. 1958;27:378–395. - PubMed
    1. Hatti-Kaul R. Aqueous two-phase systems - A general overview. Mol Biotechnol. 2001;19(3):269–277. doi: 10.1385/MB:19:3:269. - DOI - PubMed
    1. Hansson UB, Wingren C. Separation of antibodies by liquid-liquid aqueous partition and by liquid-liquid partition chromatography. Sep Purif Methods. 1998;27(2):169–211. doi: 10.1080/03602549809351640. - DOI

LinkOut - more resources