

Ondansetron and granisetron binding orientation in the 5-HT(3) receptor determined by unnatural amino acid mutagenesis
- PMID: 22873819
- PMCID: PMC3477246
- DOI: 10.1021/cb300246j
Ondansetron and granisetron binding orientation in the 5-HT(3) receptor determined by unnatural amino acid mutagenesis
Abstract
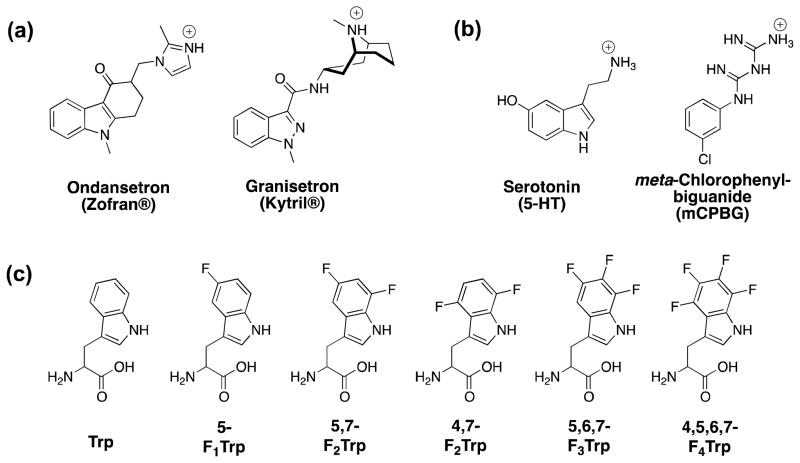
The serotonin type 3 receptor (5-HT(3)R) is a ligand-gated ion channel found in the central and peripheral nervous systems. The 5-HT(3)R is a therapeutic target, and the clinically available drugs ondansetron and granisetron inhibit receptor activity. Their inhibitory action is through competitive binding to the native ligand binding site, although the binding orientation of the drugs at the receptor has been a matter of debate. Here we heterologously express mouse 5-HT(3)A receptors in Xenopus oocytes and use unnatural amino acid mutagenesis to establish a cation-π interaction for both ondansetron and granisetron to tryptophan 183 in the ligand binding pocket. This cation-π interaction establishes a binding orientation for both ondansetron and granisetron within the binding pocket.
Figures


Similar articles
-
Locating an antagonist in the 5-HT3 receptor binding site using modeling and radioligand binding.J Biol Chem. 2005 May 27;280(21):20476-82. doi: 10.1074/jbc.M413610200. Epub 2005 Mar 21. J Biol Chem. 2005. PMID: 15781467
-
Structural basis of ligand recognition in 5-HT3 receptors.EMBO Rep. 2013 Jan;14(1):49-56. doi: 10.1038/embor.2012.189. Epub 2012 Nov 30. EMBO Rep. 2013. PMID: 23196367 Free PMC article.
-
Palonosetron exhibits unique molecular interactions with the 5-HT3 receptor.Anesth Analg. 2008 Aug;107(2):469-78. doi: 10.1213/ane.0b013e318172fa74. Anesth Analg. 2008. PMID: 18633025
-
5-HT3-receptor antagonists and the cytochrome P450 system: clinical implications.Cancer J. 2002 Sep-Oct;8(5):405-14. doi: 10.1097/00130404-200209000-00012. Cancer J. 2002. PMID: 12416899 Review.
-
5-HT(3) receptors.J Biol Chem. 2012 Nov 23;287(48):40239-45. doi: 10.1074/jbc.R112.406496. Epub 2012 Oct 4. J Biol Chem. 2012. PMID: 23038271 Free PMC article. Review.
Cited by
-
A systematic investigation of the maximum tolerated dose of cytotoxic chemotherapy with and without supportive care in mice.BMC Cancer. 2017 Oct 16;17(1):684. doi: 10.1186/s12885-017-3677-7. BMC Cancer. 2017. PMID: 29037232 Free PMC article.
-
Cation-π interactions: computational analyses of the aromatic box motif and the fluorination strategy for experimental evaluation.Phys Chem Chem Phys. 2015 Nov 21;17(43):29262-70. doi: 10.1039/c5cp04668h. Phys Chem Chem Phys. 2015. PMID: 26467787 Free PMC article.
-
Molecular Mechanisms of Nicergoline from Ergot Fungus in Blocking Human 5-HT3A Receptor.J Microbiol Biotechnol. 2024 Nov 29;35:e2411020. doi: 10.4014/jmb.2411.11020. J Microbiol Biotechnol. 2024. PMID: 39849925 Free PMC article.
-
Design, synthesis, and structure-activity relationships of highly potent 5-HT₃ receptor ligands.J Med Chem. 2012 Oct 25;55(20):8603-14. doi: 10.1021/jm300801u. Epub 2012 Oct 12. J Med Chem. 2012. PMID: 23006041 Free PMC article.
-
Novel mechanism of modulation at a ligand-gated ion channel; action of 5-Cl-indole at the 5-HT3 A receptor.Br J Pharmacol. 2016 Dec;173(24):3467-3479. doi: 10.1111/bph.13638. Epub 2016 Nov 1. Br J Pharmacol. 2016. PMID: 27677804 Free PMC article.
References
-
- Nichols DE, Nichols CD. Serotonin receptors. Chem Rev. 2008;108:1614–1641. - PubMed
-
- Thompson AJ, Lester HA, Lummis SCR. The structural basis of function in Cys-loop receptors. Q Rev Biophys. 2010;43:449–499. - PubMed
-
- Niesler B, Walstab J, Combrink S, Moller D, Kapeller J, Rietdorf J, Bonisch H, Gothert M, Rappold G, Bruss M. Characterization of the novel human serotonin receptor subunits 5-HT3C, 5-HT3D, and 5-HT3E. Mol Pharmacol. 2007;72:8–17. - PubMed
Publication types
MeSH terms
Substances
Grants and funding
LinkOut - more resources
Full Text Sources
Research Materials
Miscellaneous
