Review
. 2013 Jul 5;373(1-2):51-60.
doi: 10.1016/j.mce.2012.07.011. Epub 2012 Jul 31.

Disordered follicle development

Affiliations
Review

Disordered follicle development

R Jeffrey Chang et al. Mol Cell Endocrinol. .

Abstract

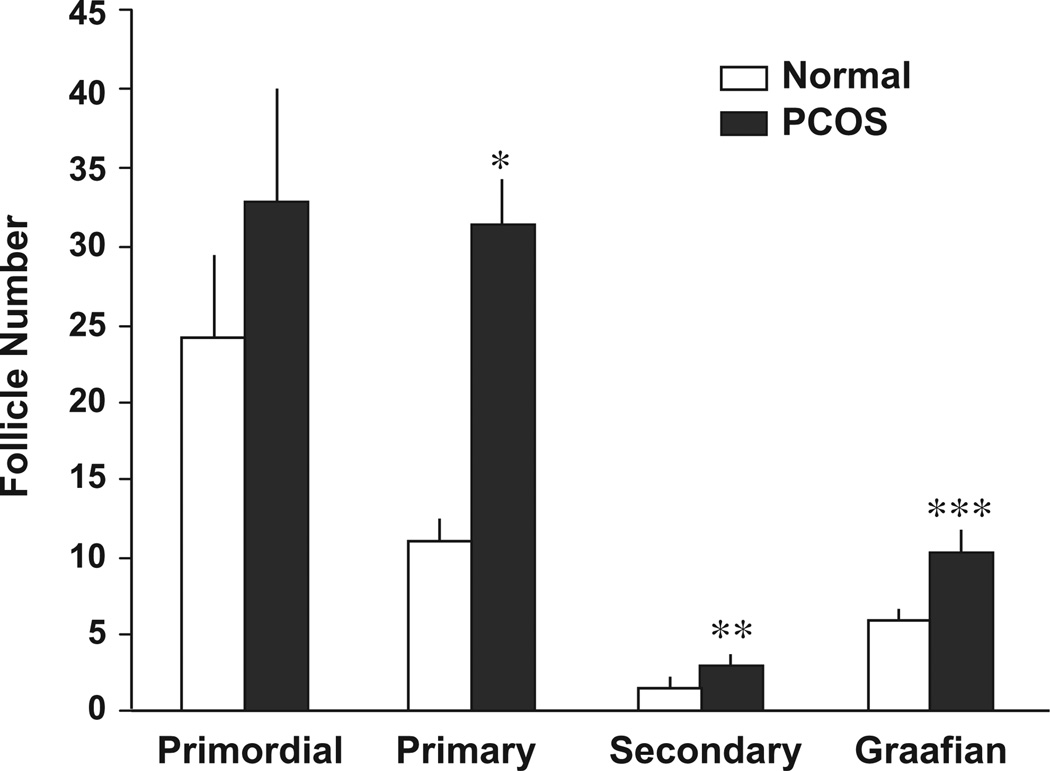
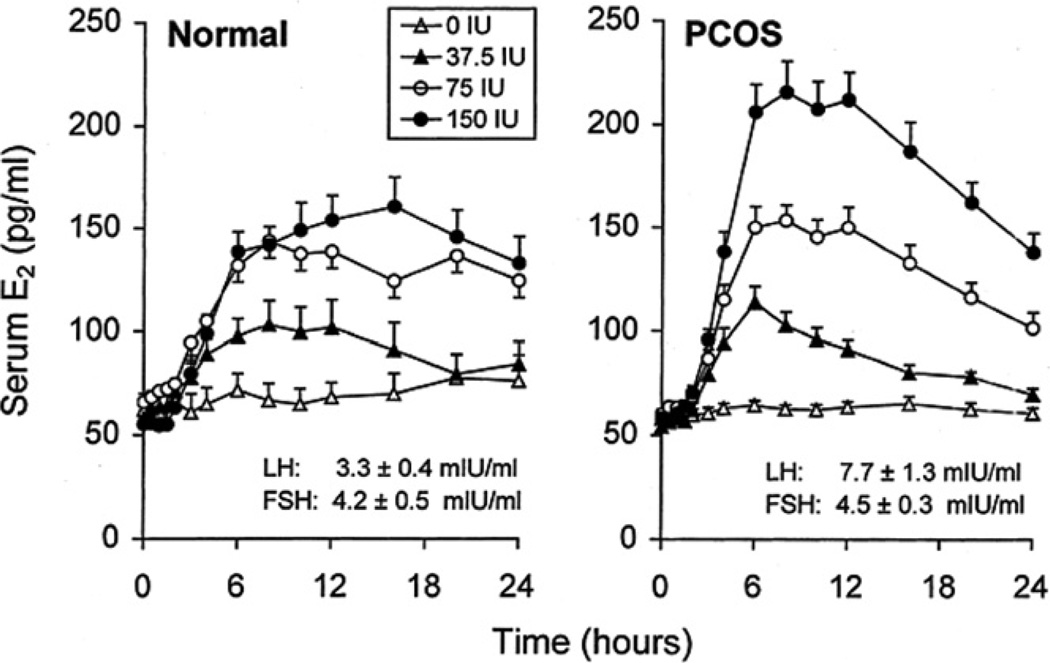
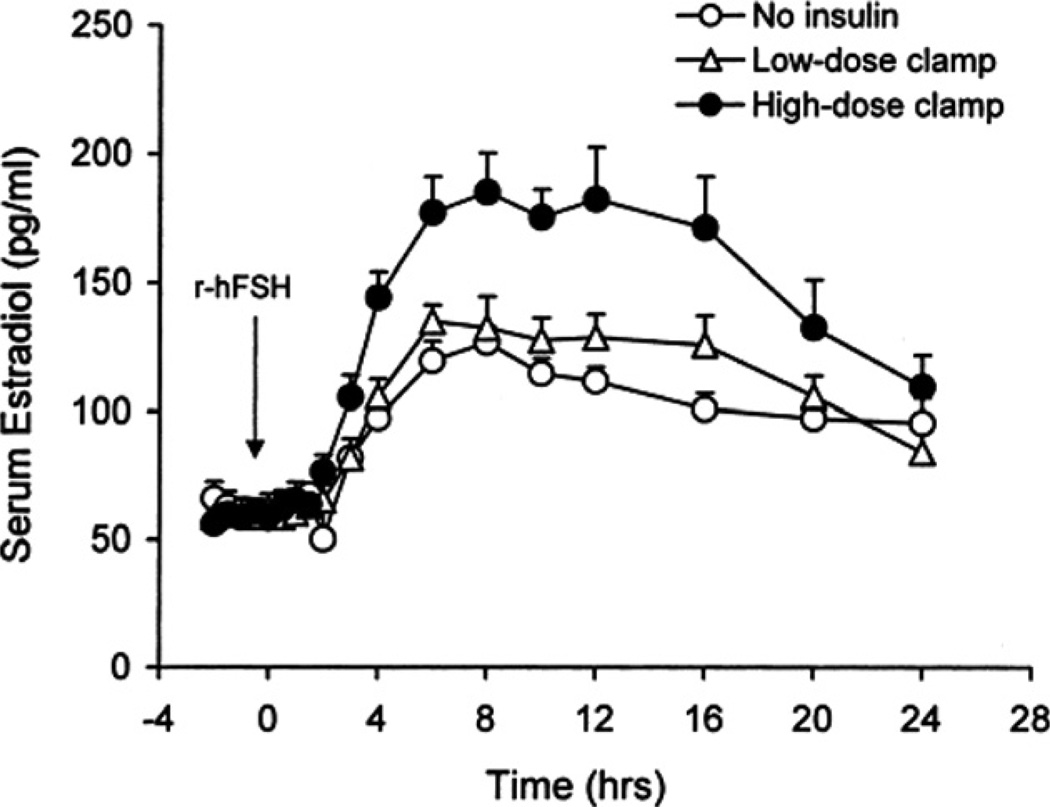
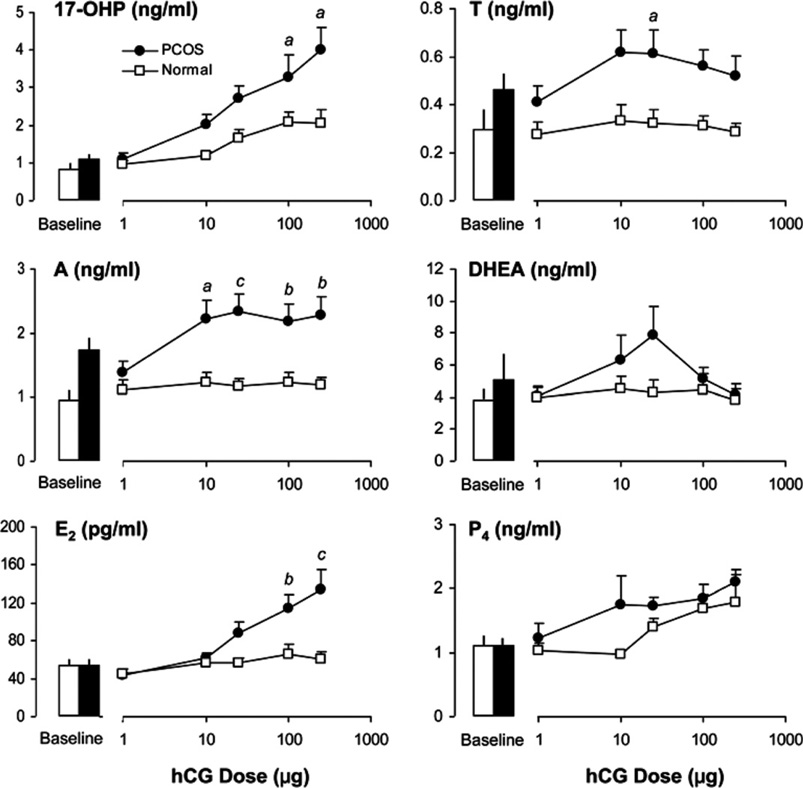
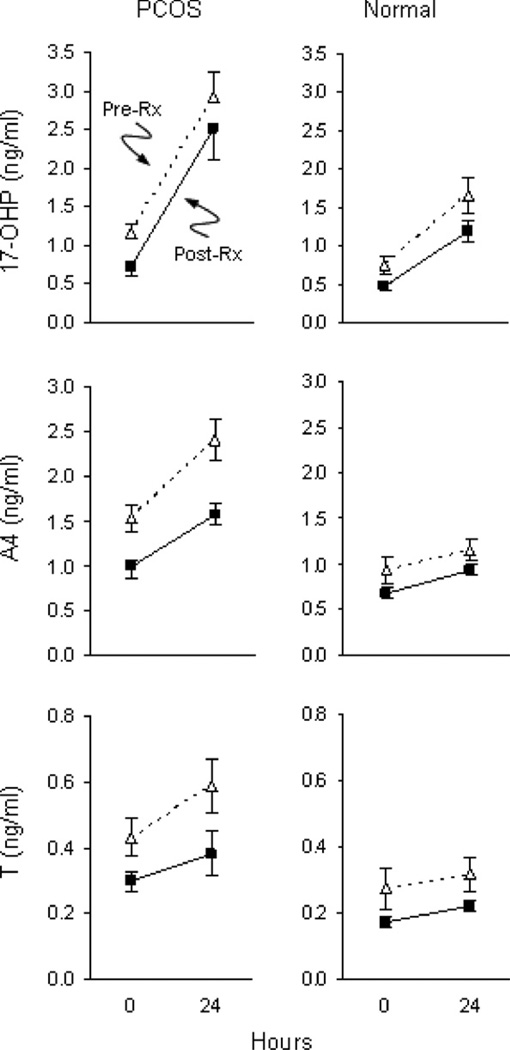
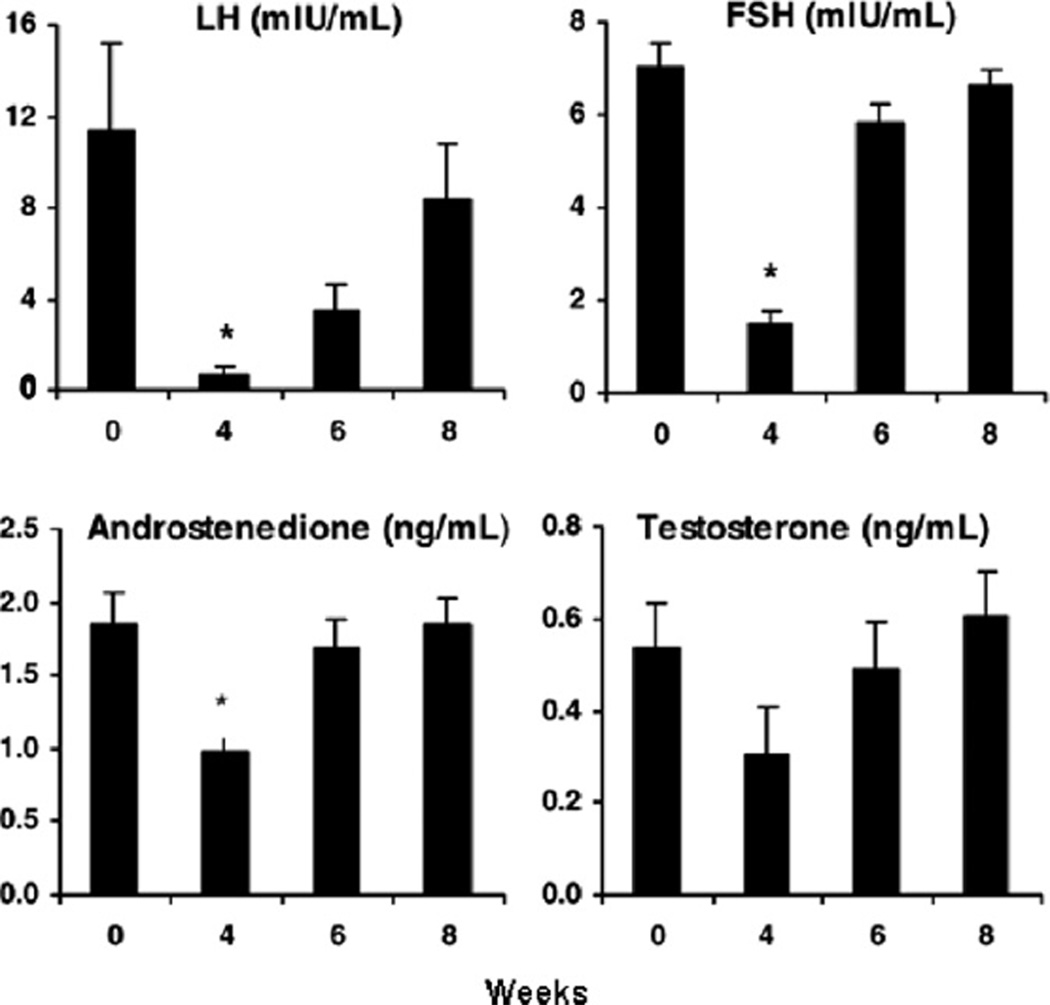
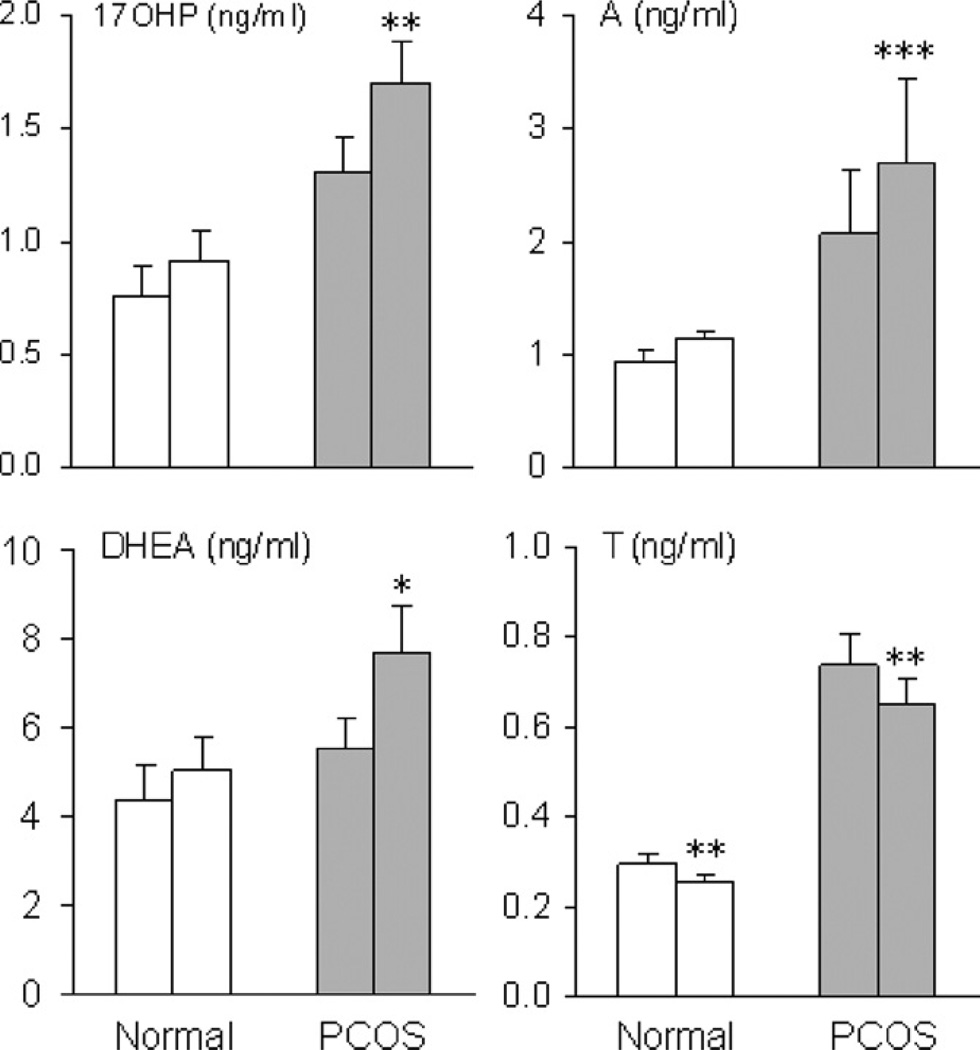
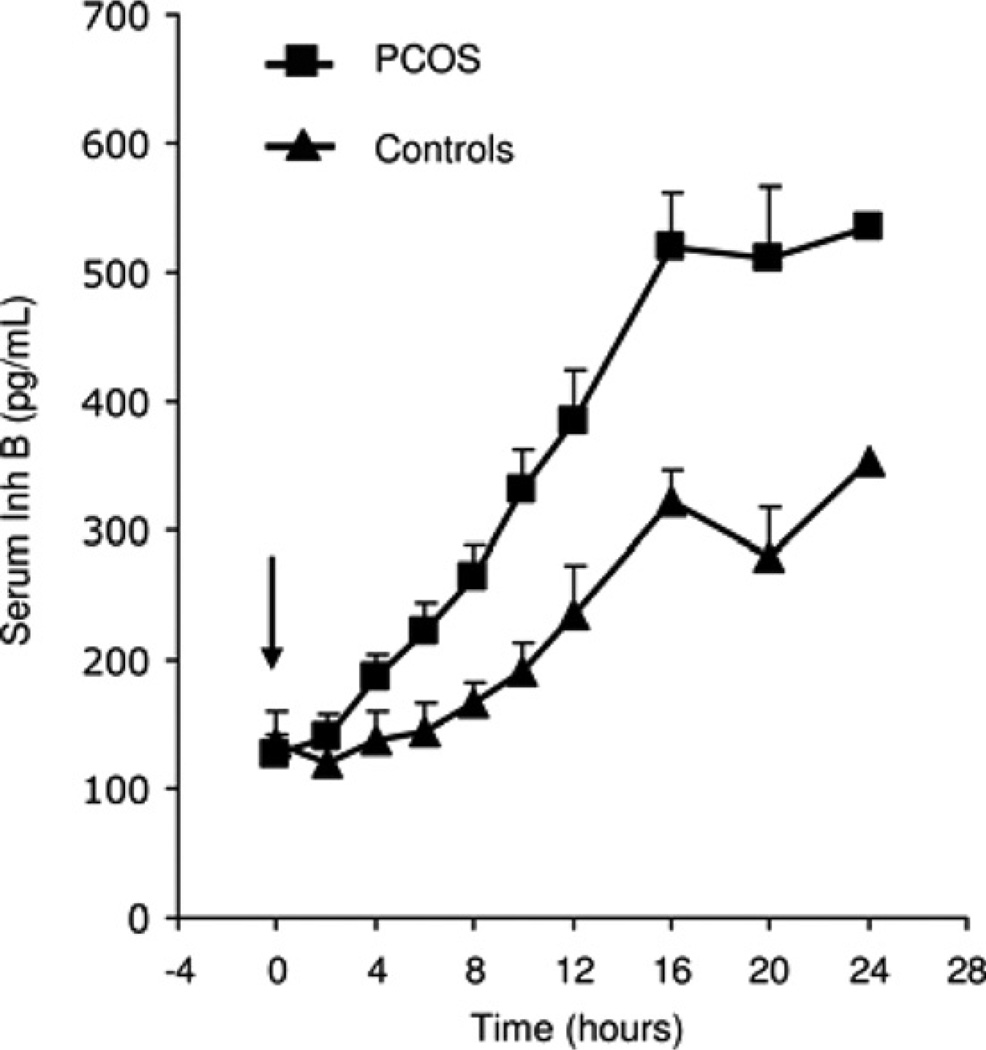
Alterations of ovarian follicle morphology and function have been well documented in women with PCOS. These include increased numbers of growing preantral follicles, failure of follicle growth beyond the mid-antral stage, evidence of granulosa call degeneration, and theca cell hyperplasia. Functional abnormalities include paradoxical granulosa cell hyperresponsiveness to FSH which is clinically linked to ovarian hyperstimulation during ovulation induction. In addition, there is likely a primary theca cell defect that accounts for the majority of excess androgen production in this disorder. The precise mechanisms responsible for altered follicle function are not completely clear. However, several factors appear to influence normal advancement of follicle development as well as impair ovarian steroidogenesis. These include intra- as well as extraovarian influences that distort normal ovarian growth and disrupt steroid production by follicle cells.


Figures

Fig. 1
Fig. 1
The size (mean ± SE) of the follicle population (primordial, primary, secondary, and Graafian) in sections of ovaries from normal and PCOS patients. *P = 0.001; **P = 0.02; ***P < 0.001.
Fig. 2
Fig. 2
Mean (±SE) serum E2 levels after intravenous administration of FSH in PCOS and normal controls. FSH administered after t = 0 h. The 0 IU dose of FSH is saline control. Mean (± SE) baseline levels of serum LH and FSH are also shown. (Conversion of E2 to SI units by factor of 3.67).
Fig. 3
Fig. 3
Time course of mean (±SE) 24 h serum E2 responses after injection of intravenous FSH, 75 IU, to PCOS women treated with pioglitazone without insulin infusion and 2 h after initiation of low-dose and high-dose hyperinsulinemic-euglycemic clamps administered for 10 h. The integrated E2 response as determined by area under the curve was significantly greater in subjects receiving high-dose insulin infusion compared with those observed for women without insulin or with low-dose insulin infusion. (Conversion of E2 to SI units by factor of 3.67).
Fig. 4
Fig. 4
Mean (±SE) baseline and 24-h serum 17-OHP, A4, T, DHEA, E2, and P4 responses to intravenous administration of 1, 10, 25, 100, and 250 µg of hCG in PCOS and normal women. Using linear mixed-effect models analyses, significant increases of 17-OHP, E2, and P4 were observed in both groups. By comparison, incremental A responses were significant only in PCOS women. Between groups, 17-OHP and A responses were significantly greater in PCOS women. Serum T responses were also higher compared to normal women, but the difference did not achieve statistical significance. Significant differences between groups in response to a fixed dose of hCG are indicated by a (P < 0.05), b (P < 0.01), and c (P < 0.001). (Conversion of 17-OHP, A4, T, DHEA, E2, and P4 to SI units by factors of 3.03, 3.49, 3.47, 3.47, 3.67, and 3.18, respectively).
Fig. 5
Fig. 5
Mean (±SE) serum 17-OHP, A4, and T levels following administration of hCG, 25 µg intravenously, prior to and after treatment with GnRH antagonist in women with PCOS and normal controls. The rise from baseline values is significant (P < 0.05) for all pre- and post-treatment responses in both groups except for the T response in normal women before GnRH antagonist. (Conversion of 17-OHP, A, T, to SI units by factors of 3.03, 3.49, and 3.47, respectively).
Fig. 6
Fig. 6
Mean (±SE) basal serum levels of LH, FSH, A and T before and 4, 6 and 8 weeks after treatment with a single injection of a long-acting GnRH agonist (depot Lupron, 3.75 mg, i.m.) in six PCOS women. *P < 0.05 versus 0 weeks. (Conversion of A4 and T to SI units by factors of 3.49 and 3.47, respectively).
Fig. 7
Fig. 7
Mean (±SE) serum 17-OHP, A4, DHEA, and T levels before and 24 h after administration of hFSH, 150 IU, in PCOS and normal women. A significant change from baseline is denoted by an asterisk. *P < 0.05; **P < 0.02; ***P < 0.001. (Conversion of 17-OHP, A4, T, and DHEA to SI units by factors of 3.03, 3.49, 3.47, and 3.47, respectively).
Fig. 8
Fig. 8
Mean (±SE) serum Inh B levels after administration of r-hFSH, 150 IU, in PCOS and normal women. Arrow indicates injection of FSH. (Conversion of Inh B to SI units by factor of 1).

Similar articles

Cited by

References

    1. Adashi EY, Hsueh AJW. Estrogens augment the stimulation of ovarian aromatase activity by follicle-stimulating hormone in cultured rat granulose cells. J. Biol. Chem. 1982;257:6077–6083. - PubMed
    1. Almahbobi G, Anderiesz C, Hutchinson P, McFarlane JR, Wood C, Trounson AO. Functional integrity of granulosa cells from polycystic ovaries. Clin. Endocrinol. 1996;44:571–580. - PubMed
    1. Barbieri RL, Makris A, Ryan KJ. Insulin stimulates androgen accumulation in incubations of human ovarian stroma and theca. Obstet. Gynecol. 1984;64:73S–80S. - PubMed
    1. Barbieri RL, Makris A, Randall RW, Daniels G, Kistner RW, Ryan KJ. Insulin stimulates androgen accumulation in incubations of ovarian stroma obtained from women with hyperandrogenism. J. Clin. Endocrinol. Metab. 1986;62:904–910. - PubMed
    1. Barnes RB, Rosenfield RL, Burstein S, Ehrmann DA. Pituitary-ovarian responses to nafarelin testing in the polycystic ovary syndrome. N. Engl. J. Med. 1989;320:559–565. - PubMed

Publication types

MeSH terms