. 2012 Nov;8(11):1577-89.
doi: 10.4161/auto.21376. Epub 2012 Aug 9.

Autophagy is a protective response to ethanol neurotoxicity

Affiliations

Autophagy is a protective response to ethanol neurotoxicity

Gang Chen et al. Autophagy. 2012 Nov.

Abstract

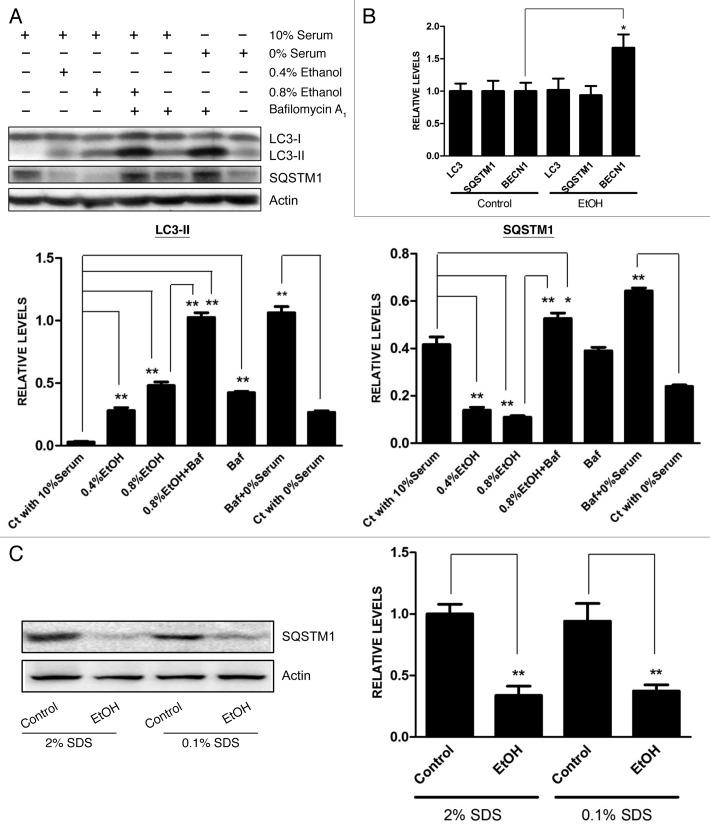
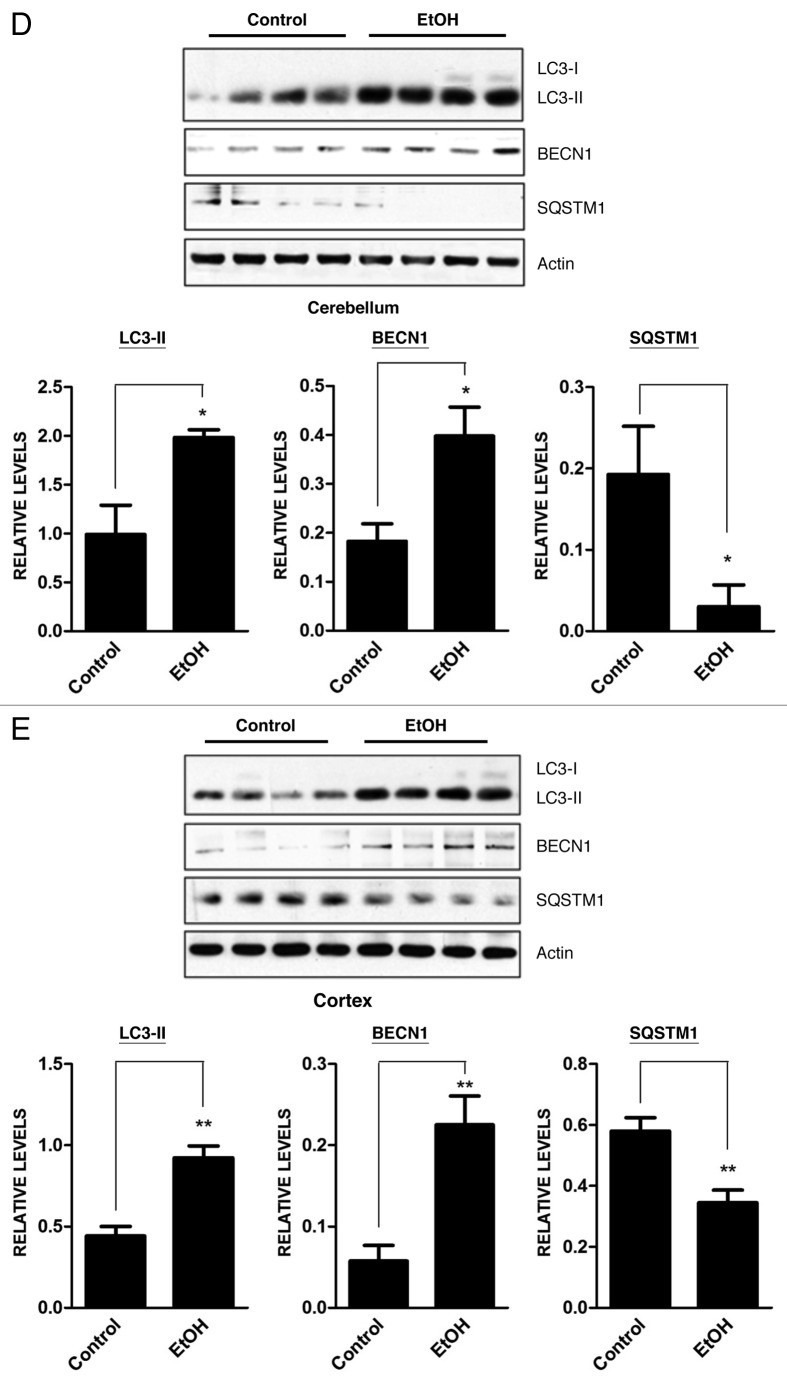
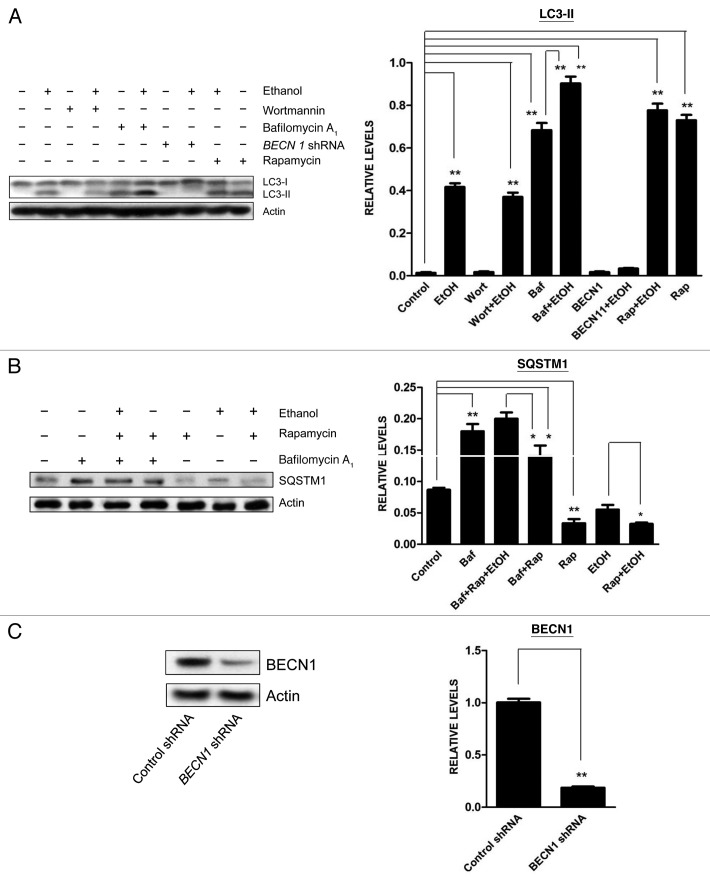
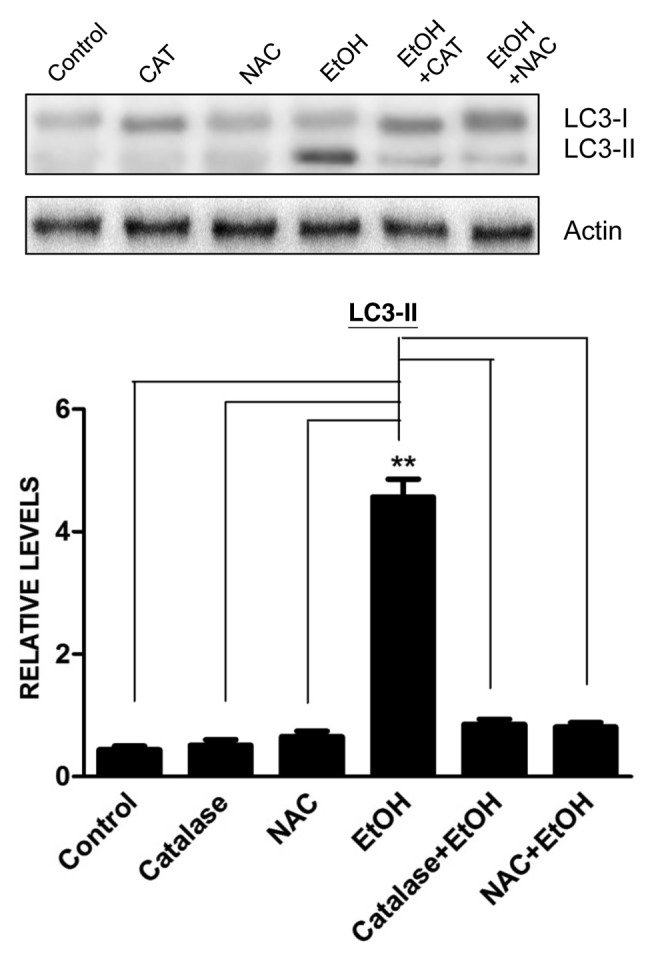
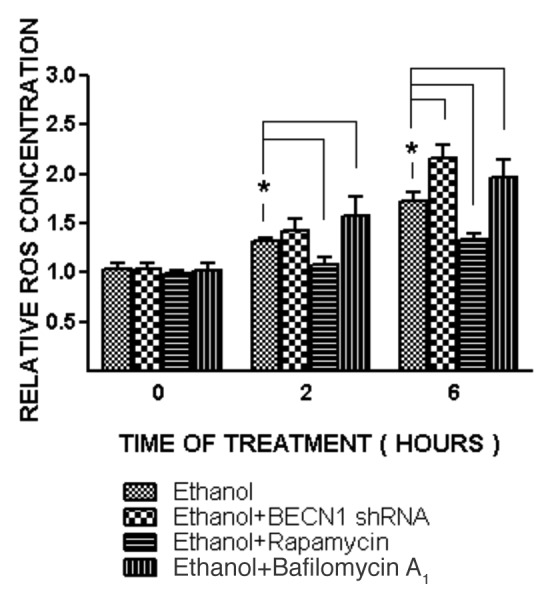
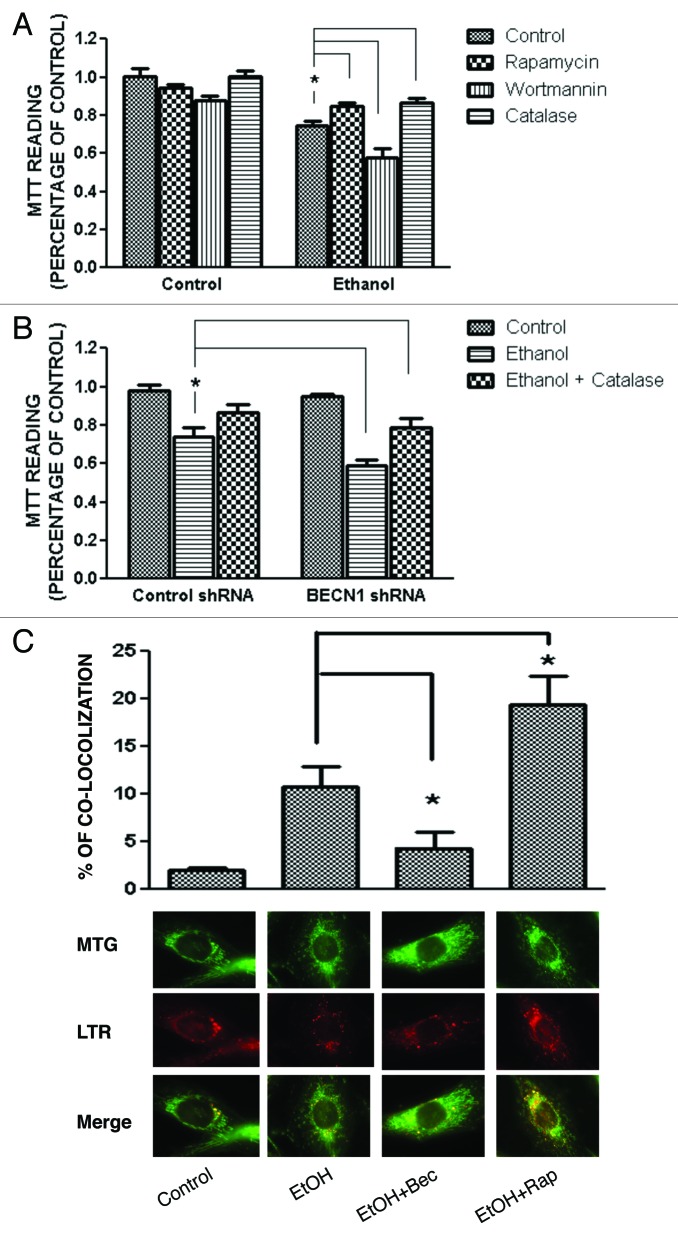
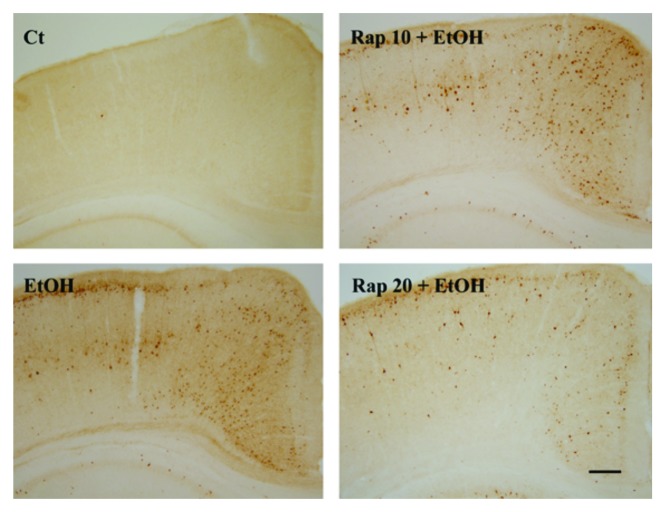
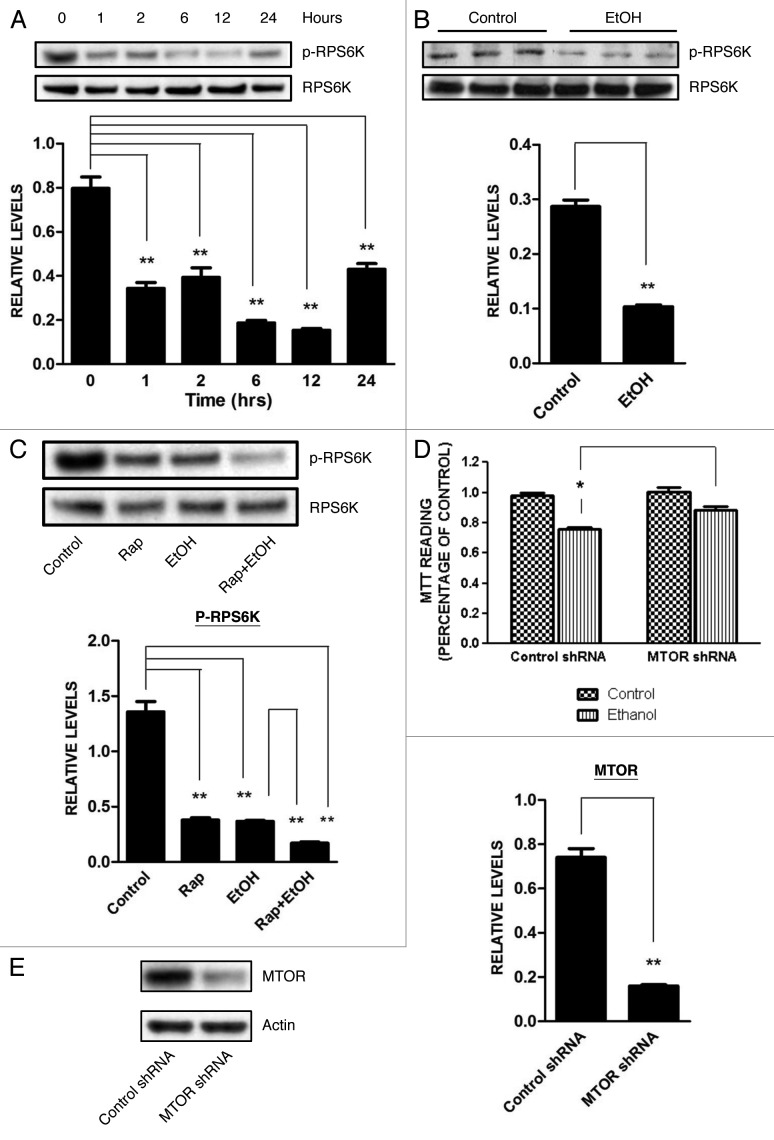
Ethanol is a neuroteratogen and neurodegeneration is the most devastating consequence of developmental exposure to ethanol. The mechanisms underlying ethanol-induced neurodegeneration are complex. Ethanol exposure produces reactive oxygen species (ROS) which cause oxidative stress in the brain. We hypothesized that ethanol would activate autophagy to alleviate oxidative stress and neurotoxicity. Our results indicated that ethanol increased the level of the autophagic marker Map1lc3-II (LC3-II) and upregulated LC3 puncta in SH-SY5Y neuroblastoma cells. It also enhanced the levels of LC3-II and BECN1 in the developing brain; meanwhile, ethanol reduced SQSTM1 (p62) levels. Bafilomycin A(1), an inhibitor of autophagosome and lysosome fusion, increased p62 levels in the presence of ethanol. Bafilomycin A(1) and rapamycin potentiated ethanol-increased LC3 lipidation, whereas wortmannin and a BECN1-specific shRNA inhibited ethanol-promoted LC3 lipidation. Ethanol increased mitophagy, which was also modulated by BECN1 shRNA and rapamycin. The evidence suggested that ethanol promoted autophagic flux. Activation of autophagy by rapamycin reduced ethanol-induced ROS generation and ameliorated ethanol-induced neuronal death in vitro and in the developing brain, whereas inhibition of autophagy by wortmannin and BECN1-specific shRNA potentiated ethanol-induced ROS production and exacerbated ethanol neurotoxicity. Furthermore, ethanol inhibited the MTOR pathway and downregulation of MTOR offered neuroprotection. Taken together, the results suggest that autophagy activation is a neuroprotective response to alleviate ethanol toxicity. Ethanol modulation of autophagic activity may be mediated by the MTOR pathway.

Keywords: alcohol; cerebellum; cerebral cortex; fetal alcohol spectrum disorders; mitophagy; neurodegeneration.


Figures

None
Figure 1A–C. Effect of ethanol on the expression of autophagic markers. (A) SH-SY5Y cells were maintained in media containing 10% serum or 0% serum. The cells were exposed to ethanol (EtOH: 0, 0.4% or 0.8%) for 8 h. In some experimental groups, cells were treated with bafilomycin A1 (Baf: 10 nM). The levels of LC3-II and SQSTM1 were examined with immunoblotting (top panel). The experiment was replicated three times. The levels of LC3-II and SQSTM1 were quantified by densitometry and normalized to actin levels (bottom panels). *p < 0.05, **p < 0.01. (B) SH-SY5Y cells were exposed to ethanol (EtOH, 0.8%) for 8 h and the mRNA levels for LC3, SQSTM1 and BECN1 were analyzed by qRT-PCR as described under Materials and Methods. The experiment was replicated three times. *p < 0.05. (C) SH-SY5Y cells were exposed to ethanol (EtOH, 0.8%) for 8 h, and the proteins were extracted by RIPA buffer containing 2% or 0.1% SDS. The level of SQSTM1 was determined by immunoblotting (top panel) and quantified (bottom panel). *p < 0.05.
None
Figure 1D and E. Effect of ethanol on the expression of autophagic markers. (D and E) Mice of postnatal day 7 (PD7) were injected subcutaneously with ethanol (2.5 g/kg or saline) at 0 and 2 h as described under Materials and Methods. At 8 h after the first injection, the cerebellum (D, top panel) and cerebral cortex (E, top panel) were removed, protein was extracted and the levels of LC3, BECN1 and SQSTM1 were analyzed by immunoblotting. The results represent samples obtained from four control and four ethanol-exposed mouse pups. Relative levels of LC3-II, BECN1 and SQSTM1 were determined by densitometry and normalized to actin levels (bottom panels). *p < 0.05, **p < 0.01.
None
Figure 2. Effect of ethanol on autophagic flux in SH-SY5Y cells. SH-SY5Y cells were treated with ethanol (0 or 0.8%) in the presence/absence of wortmannin (Wort: 10 µM), bafilomycin A1 (Baf: 10 nM), rapamycin (Rap: 10 nM) or BECN1 shRNA (BECN1). The protein samples were collected 8 h after the treatment. The levels of LC3 (A) and SQSTM1 (B) were examined with immunoblotting (top panel). The experiment was replicated three times. Relative levels of LC3-II or SQSTM1 were determined by densitometry and normalized to actin levels (bottom panel). *p < 0.05, **p < 0.01. (C) Cells were transfected with BECN1 shRNA for 24 h and downregulation of BECN1 by shRNA was confirmed by immunoblotting (top panel). Relative BECN1 level was determined by densitometry and normalized to actin levels (bottom panel). **p < 0.01.
None
Figure 3. Effect of ethanol on the formation of GFP-LC3 puncta in SH-SY5Y cells. (A) SH-SY5Y cells were transfected with a GFP-LC3 plasmid and exposed to ethanol (EtOH, 0 or 0.8%) in the presence/absence of bafilomycin A1 (Baf: 10 nM) or wortmannin (Wort: 10 µM) for 6 h. In some experimental groups, cells were cotransfected with BECN1 shRNA (BEC). The formation of GFP-LC3 puncta was examined under a fluorescence microscope 6 h after ethanol exposure. (B) GFP-LC3 puncta/cell was quantified as described under Materials and Methods. The data represent the mean and SEM of three replications. *p < 0.05.
None
Figure 4. Effect of antioxidants on ethanol-induced LC3-II upregulation. SH-SY5Y cells were treated with ethanol (EtOH: 0.4%) with/without catalase (10,000 U/ml) or N-acetyl-cysteine (NAC: 10 mM). Cell lysates were collected 6 h after the treatment. The level of LC3 was determined by immunoblotting (top panel). The experiment was replicated three times. Relative LC3-II levels were determined by densitometry and normalized to actin levels (bottom panel). **p < 0.01.
None
Figure 5. Effect of ethanol on ROS generation in SH-SY5Y cells. SH-SY5Y cells were treated with ethanol (0 or 0.8%) with/without rapamycin (10 nM) or bafilomycin A1 (10 nM) for 2 or 6 h. In some experimental groups, cells were treated with BECN1 shRNA to downregulate the expression of BECN1. ROS generation was measured as described under the Materials and Methods and relative amounts of ROS are presented. The data represent the mean and SEM of three replications. *p < 0.05.
None
Figure 6. Effect of ethanol, rapamycin, wortmannin, catalase or BECN1 shRNA on the viability of SH-SY5Y cells. SH-SY5Y cells were treated with ethanol (0 or 0.8%) with/without rapamycin (10 nM), catalase (10,000 U/ml) or wortmannin (10 µM) for 48 h (A). In some experimental groups, cells were treated with a BECN1 shRNA to downregulate the expression of BECN1 (B). Cell viability was determined by MTT assay as described under Materials and Methods. The data represent the mean and SEM of three replications. *p < 0.05. SH-SY5Y cells were treated with 0.8% ethanol (EtOH) with/without 10 nM rapamycin (EtOH + Rap) and BECN1 shRNA (EtOH + BECN1). Mitochondria and lysosomes were detected by specific dyes as described under the Materials and Methods (MTG for mitochondria and LTR for lysosomes). The percentage of mitochondria that were colocalized with lysosomes under each treatment condition was calculated. The mean ± SEM of 120 cells for each treatment condition is presented (C). *p < 0.05.
None
Figure 7. Effect of ethanol and rapamycin on caspase-3 activation in the developing brain. PD7 mice were injected with ethanol (0 or 5 g/kg) and/or rapamycin (10 mg/kg or 20 mg/kg, Rapa: 10 or 20). The expression of active CASP3/caspase-3 in the cerebral cortex was examined 8 h after the injection by immunohistochemistry as described under Materials and Methods. Scale bar: 100 μm. The experiment was replicated three times.
None
Figure 8. Effect of ethanol on the MTOR pathway. (A) SH-SY5Y cells were treated with ethanol (0 or 0.4%) for the indicated times. The phosphorylation of RPS6K, a substrate of MTOR, was determined by immunoblotting (top panel). Relative level of RPS6K was quantified by densitometry and normalized to total RPS6K (bottom panel). **p < 0.01. (B) PD7 mice were injected with ethanol (0 or 5 g/kg) for 8 h as described above. The phosphorylation of RPS6K in the cerebral cortex was determined by immunoblotting (top panel) and was quantified by densitometry (bottom panel). **p < 0.01. (C) SH-SY5Y cells were treated with ethanol (0 or 0.4%) with/without rapamycin (Rap: 10 nM) for 6 h. The phosphorylation of RPS6K was determined by immunoblotting (top panel) and was quantified by densitometry (bottom panel). **p < 0.01. (D) The level of MTOR was knocked down by an MTOR shRNA as described under Materials and Methods. Cells were exposed to ethanol (0 or 0.8%) for 48 h and cell viability was determined by MTT assay. The data represent the mean and SEM of three replications. *p < 0.05. (E) Downregulation of MTOR by shRNA was confirmed by immunoblotting. **p < 0.01.

Similar articles

Cited by

References

    1. Riley EP, McGee CL. Fetal alcohol spectrum disorders: an overview with emphasis on changes in brain and behavior. Exp Biol Med (Maywood) 2005;230:357–65. - PubMed
    1. Tang D, Kang R, Zeh HJ, 3rd, Lotze MT. High-mobility group box 1, oxidative stress, and disease. Antioxid Redox Signal. 2011;14:1315–35. doi: 10.1089/ars.2010.3356. - DOI - PMC - PubMed
    1. Yang C, Han LO. Knockdown of Beclin 1 inhibits vitamin K3‑induced autophagy, but promotes apoptosis of human hepatoma SMMC-7721 cells. Mol Med Report. 2010;3:801–7. - PubMed
    1. Larsen KB, Lamark T, Øvervatn A, Harneshaug I, Johansen T, Bjørkøy G. A reporter cell system to monitor autophagy based on p62/SQSTM1. Autophagy. 2010;6:784–93. doi: 10.4161/auto.6.6.12510. - DOI - PubMed
    1. Chen Y, Gibson SB. Is mitochondrial generation of reactive oxygen species a trigger for autophagy? Autophagy. 2008;4:246–8. - PubMed

Publication types

MeSH terms