. 2012 Jul-Aug;6(4):290-307.
doi: 10.4161/chan.21063. Epub 2012 Jul 1.

Mechanosensitive Ca(2+) permeant cation channels in human prostate tumor cells

Affiliations

Mechanosensitive Ca(2+) permeant cation channels in human prostate tumor cells

Rosario Maroto et al. Channels (Austin). 2012 Jul-Aug.

Abstract

The acquisition of cell motility plays a critical role in the spread of prostate cancer (PC), therefore, identifying a sensitive step that regulates PC cell migration should provide a promising target to block PC metastasis. Here, we report that a mechanosensitive Ca(2+)-permeable cation channel (MscCa) is expressed in the highly migratory/invasive human PC cell line, PC-3 and that inhibition of MscCa by Gd(3+) or GsMTx-4 blocks PC-3 cell migration and associated elevations in [Ca(2+)](i). Genetic suppression or overexpression of specific members of the canonical transient receptor potential Ca(2+) channel family (TRPC1 and TRPC3) also inhibit PC-3 cell migration, but they do so by mechanisms other that altering MscCa activity. Although LNCaP cells are nonmigratory, they also express relatively large MscCa currents, indicating that MscCa expression alone cannot confer motility on PC cells. MscCa in both cell lines show similar conductance and ion selectivity and both are functionally coupled via Ca(2+) influx to a small Ca(2+)-activated K(+) channel. However, MscCa in PC-3 and LNCaP cell patches show markedly different gating dynamics--while PC-3 cells typically express a sustained, non-inactivating MscCa current, LNCaP cells express a mechanically-fragile, rapidly inactivating MscCa current. Moreover, mechanical forces applied to the patch, can induce an irreversible transition from the transient to the sustained MscCa gating mode. Given that cancer cells experience increasing compressive and shear forces within a growing tumor, a similar shift in channel gating in situ would have significant effects on Ca(2+) signaling that may play a role in tumor progression.


Figures

None
Figure 1. Transmission and fluorescent confocal images of LNCaP and PC-3 cells labeled with 200 nM BODIPY FL thapsigargin to measure ER/internal Ca2+ store distribution. (A) The LNCaP cell shows a typical spindle-shaped, multipolar morphology. (B) The transmission-image outline of the LNCaP cell overlaps with the fluorescent image indicating a uniform ER distribution within the cytoplasm and ER adjacent to the surface membrane. The fluorescent image represents the maximum intensity projection reconstructed from a stack of 25 confocal sections obtained at 0.2 μm intervals. (C) The PC-3 cell shows a typical polarized morphology with a broad flat lamellipodium and a thin, trailing tether. (D) The fluorescent image indicates a lack of thapsigargin-related signal around the general perimeter of the cell, particularly from within the lamella and lamellipodium consistent with ER absence in these regions.
None
Figure 2. The typical time course for tight-seal formation on LNCaP and PC-3 cells. (A) A test pulse of 1 mV was applied to monitor the pipette resistance during the application of a suction ramp applied after first contact with the LNCaP cell surface; a tight seal of ~10 gigaohms was formed within 0.5 sec of applying the ramp that ended at 5 mmHg. (B) Sealing on PC-3 cells required a longer duration (15 sec) and stronger suction (40 mmHg) to form tight seals that were also not as tight (i.e., ~1 vs 10 GΩ) as those achieved on LNCaP cells.
None
Figure 3. Typical MS currents in PC-3 cell patches activated by suction steps or ramps. (A) An initial suction step of 40 mmHg activated unitary currents of ~2 pA and subsequent larger steps activated larger and more sustained MS currents that lasted for the full duration of the pulse. (B) A staircase increase in suction caused a sigmoidal activation of MS current that turned on at ~40 mmHg and saturated at ~100 mmHg. (C) The responses of a different PC-3 cell patch in which the initial suction step of 40 mmHg activated a delayed (50 ms) and slow rising MS current that also showed a delayed turn-off after the step. With increasing step-size the delay time for activation was reduced without altering the delayed turn-off. (D) Same patch as in C showing the delayed turn-off after ramps. Patch potential was -100 mV and the pipette solution was 100 K+/0 Ca2+.
None
Figure 4. A minority (~5%) of PC-3 patches displayed mechanically-fragile, transient MS current behavior. (A) Transient MS currents activated by repetitive 20 mmHg suction pulses in a PC-3 cell patch. (B) The same PC-3 cell patch in which the first suction step of 50 mmHg activated a transient MS current but subsequent pulses activated progressively smaller peak MS currents with increased sustained unitary current activity. (C) A different PC-3 cell patch that initially responded to a train of pulses (1 sec, 40 mmHg at 0–5/s) with biphasic MS currents that displayed an initial fast transient phase followed by a sustained phase. After 30 sec of continued stimulation the transient phase was abolished leaving the sustained phase intact.
None
Figure 5. Similar sustained MscCa currents can be activated over all regions of polarized PC-3 cells. (A) Photomicrograph of a migrating PC-3 cell showing distinct morphological regions that include the forward protruding lamella/lamellipodium (L), the cell body with the thick nuclear region (CB), and the trailing rear tether (RT). (B) shows cell-attached patch recordings made from each region on different PC-3 cells. Over all regions ~20% of patches were null for MS currents and the mean current amplitudes of active patches for the different regions were L: 23.5 ± 3.58 pA (n = 22); CB: 24.5 ± 2.56 pA (n = 38); and RT: 26.0 ± 3.8173 (n = 22) (patch potential -100 mV, 100 K/0 Ca)
None
Figure 6. The typical transient MS current behavior recorded in LNCaP cell patches. (A) Increasing suction steps activate transient MS currents that decay to baseline within ~200 ms. A MS current of ~10 pA was activated by a 5 mmHg pulse and the response saturated at ~150 pA with a 40 mmHg pulse (patch potential -100 mV). (B) Ramps of suction applied to an LNCaP cell patch activated a transient current at the beginning of the ramp that declined back to baseline despite increasing suction, later in the ramp there with a reactivation of noisy current that turned off with the ramp. (C) A train of 100 ms pulses activate transient currents that do not decrease in amplitude during the train (i.e., no response fading). (D) the same patch as in (C) in which a train of 1 sec pulses results in a progressive decrease in the peak current response (i.e., fading) and increase in the sustained current. In this train by the 8th pulse the peak current had decreased by 90% from the initial ~150 pA to a small sustained current of ~15 pA. This fading of the current was irreversible in that resting the patch for 3 min did not result in recovery of the initial larger currents (patch potential -100 mV, pipette solution 100 mM K+/0 mM Ca2+).
None
Figure 7. The mechanical-induced inactivation of MS current seen in LNCaP cells is not strongly voltage dependent and currents show a similar decay time when measured at depolarized or hyperpolarized patch potentials. (A) On the patch held at 75 mV a train of 20 mmHg suction 1 sec pulses activated large, transient MS currents that decayed back to near baseline within 100 ms. (B) The same train of pulses applied to the same patch but held at -25 mV which again result in similar fast decaying currents. In this patch the MS current reversed at ~0 mV which accounts for the different amplitude currents at these potentials; note the different current scales in (A and B). The application of the smaller 20 mmHg pulses did not result in the response fading that occurred with 80 mmHg pulses described for the patch Figure 6D.
None
Figure 8. Stimulation protocols that can distinguish MS channel adaptation (i.e., reduction in mechanosensitivity) from channel inactivation. (A) A step-up protocol in which the initial suction step to 30 mmHg activates a peak MS current of ~60 pA that decays to baseline leaving only residual current activity. A step-up directly from 30 mmHg to 60 mmHg failed to reactivate the large transient current but instead only evoked a low-level, sustained activity (~5 pA). (B) On the same patch as in A, a 30 mmHg pulse activates again a large transient current (~70 pA) with a low level of sustained current, then 1 sec after the first pulse a 60 mmHg pulse was applied and activated an even larger transient current of ~120 pA (100 K+/0 Ca2+ pipette solution, patch potential -100 mV).
None
Figure 9. Single MS channel currents and current-voltage relations measured in PC cell-attached patches. (A) Suction steps applied to a PC-3 cell-attached patch held at different patch potentials (-100, -50 and 50 mV) activated unitary currents that showed relatively more frequent fast channel closures and re-openings at negative compared with positive potentials. Also at the most hyperpolarized potential there were spontaneous fast inward currents that displayed the same amplitude as the stretch-activated unitary currents. (B) Single-channel current-voltage relations measured on cell-attached PC-3 patches (hollow circles) and LNCaP cell patches (solid circles) measured with 100 K+/ 0 Ca2+ pipette solution. Both single channel currents show the same weak inward rectification indicating the same or closely-related pore structures. Data points based on 20–30 patches for each PC cell type. Estimation of the zero patch potential for the I-V relation was based on the adjusted potential offset at which MS channel currents reversed with high K+ pipette solution. The offset potential was consistent with a resting potential ranging from -30 to -50 mV (uncorrected for liquid junction potential) which was similar to the range measured in the whole cell configuration.
None
Figure 10. Both PC-3 and LNCaP cells express big conductance (BK) and small conductance (SK) Ca2+-activated K+ channels. (A) Cell-attached patch current traces recorded from a PC-3 cell that was bathed in 5 μM ionomycin added to normal Krebs. The unitary outward currents were recorded at approx. -10 mV with a pipette solution of 100 Na+/1Ca2+. (B) The unitary current-voltage relations of the BK and SK channels measured in the same patch. (C) A different PC-3 cell-attached patch depolarized to 100 mV expressed large amplitude, brief events that were not stretch sensitive (pipette solution was 100 K+/0 Ca2+ bathed in only normal Krebs (i.e., without ionomycin). (D) The same patch as in (C) except the patch potential was held at -100 mV. The trace shown was specifically selected to include the two types of channel activity—a low frequency (< 0.01 sec−1) random occurrence of brief, large amplitude BK channel currents and MS current that in this case showed a delay in activation of ~200 ms—otherwise BK channel openings were not observed to increase with suction.
None
Figure 11. MscCa is functionally coupled, via Ca2+ influx, to SK channel activation. (A) Consecutive current traces recorded from a PC-3 cell-attached patch at -10 mV with a pipette solution 100 Na+/1 Ca2+. Under these conditions suction pulses caused initial activation of inward currents followed by a delayed activation of single outward channel unitary currents of ~0.5 pA, significantly the latter outward currents were not activated if Ca2+ was left out of the pipette solution even though the inward currents were typically bigger presumably because of lack of Ca2+ channel block of MscCa (data not shown). According to the I-V shown in Figure 10B, the 0.5 pA outward currents recorded at -10 mV are most consistent with SKchannel activity rather than BK channels that should be ~8 time larger at ~4 pA. Consistent with this idea depolarization of the same patch to ≥ 50 mV activated brief outward unitary currents ≥ 12 pA consistent with BK channel currents. (B) LNCaP cell-attached patch current trace measured under the same recording conditions as in Figure 11 A (i.e., -10 mV 100 Na+/1 Ca2+). In this case the suction pulse activated a transient inward current followed by delayed activation of unitary outward currents of ~0.5 pA, again the inward, but not the outward currents, were activated when Ca2+ was replaced by EGTA in the the pipette solution.
None
Figure 12. MS currents in PC-3 cells are blocked by the tarantula venom peptide GsMTx-4. (A) PC-3 cell-attached patch stimulated with a suction pulse (top trace) approximately 10 sec after forming a tight seal, at this point before the peptide had reached the channel “control” MS channel activity could be measured (100 KCl and 5 Hepes solution in the pipette tip ~300 μm from the orifice). The trace below labeled “GsMTx-4” was recorded 3 min later and indicates that the MS current activity had been abolished presumably as the 3 μM GsmTx4 solution (backfilled into the pipette) equilibrated with the solution in the pipette tip. The slow outward current reflects a diffusion potential current that correlates with the time course of the suction pulse; the fast events may reflect the activity of GsMTx-4 blocked channels. (B) Same patch as in indicating the GsMTx4 blocks the ramp-induced MS current recorded before GsMTx-4 block.
None
Figure 13. MS channel blockers, Gd3+ and GsMTx-4, block PC-3 cell migration. (A) Selected video frames taken 30 min apart showing PC-3 cells migrating out of a cluster. (B) Representative trajectories (monitored every 5 min) before, during, and after application of 5 μM Gd3+ (left panel) and 3 μM GsMTx-4 (right panel) to the solution bathing the cells. (C) Histograms based on 25 or more cells (mean ± SEM) showing reversible block of PC-3 cell migration by Gd3+ (left histogram) and GsMTx-4. (right histogram).
None
Figure 14. Intracellular Ca2+ concentration ([Ca2+]i) gradients and Ca2+ transients in migrating PC-3 cells. (A) Selected fluorescence microscopy video frames using Fura-2 to monitor [Ca2+]i changes in a single PC-3 cell as it migrates from left to right. The four panel left to right represent specific frames capture at 0, 70, 140 and 210 min (i.e., the total time the cell was monitored was 3.5 h). As the PC-3 cell extends its lamellipodia and moves toward the right a [Ca2+]i gradient develops within the cell with higher Ca2+ in the rear compared with the front of the cell. The color bar indicates low [Ca2+]i is blue and high [Ca2+]i is red. (B) [Ca2+]i imaging of two PC-3 cell initially migrating in opposite directions and with opposite [Ca2+]i gradients (30 min frame) (arrows). In the next frame (125 min) cell #1 had reversed its migration direction and there is an accompany reversal of [Ca2+]i gradient. The same cell expressed a brief Ca2+ transient (136 min frame) with a total duration less that one frame (i.e., 1 min) and which was followed by retraction of its tether (145 min) and continued cell movement in the different direction (186 min). The original video recording was made over 4.8 h period. (C) Fast Ca2+ transients in a migrating PC-3 cell. Images from left to right show two different PC-3 cells, in which the migrating cell (#1) undergoes [Ca2+]i transients while the stationary cell (#2) does not. For all images a 100X 1.3 NA objective was used. (D) GsMTx-4 reversibly blocked migration and reduced [Ca2+]i elevations in PC-3 cells. Fura-2 fluorescent images of PC-3 cells, before, after 5 min exposure to 3 μM GsmTx-4 solution, and 30 min following the GsmTx-4 solution washout. These images were taken with a 20X 0.75 objective.
None
Figure 15. LNCaP cells show Ca2+ transients that are blocked by GsMTX-4. (A) [Ca2+]i imaging of an LNCaP cell showing two Ca2+ transients at 20 min and at 22–23 min after beginning the recording. The lower graph is a line scan of [Ca2+]i levels (340/380 ratio) in the same cell showing two bursts of [Ca2+]i transients. (B) Line scan on another LNCaP cell in which 3 μM GsmTx-4 was applied (dashed line), causing a reversible decrease in the [Ca2+]i, as well as blocking the Ca2+ transients. (C) [Ca2+]i imaging of an LNCaP cell where the arrows indicate the fast and reversible formation of protrusions accompanied by transient local [Ca2+]i elevations.
None
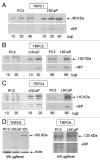
Figure 16. Protein immunoblot (Western) measurement of expression of specific canonical transient receptor potential (TRPC) family members (TRPC1, 3, 4, 5, and 6) in PC-3 and LNCaP cells. (A) Western blots showing the expression of a ~80 kDa band labeled by an anti-TRPC1 antibody with different loading amounts of PC-3 and LNCaP cell membranes (10, 20 and 40 μg) run in the absence and presence of the TRPC1 antigenic/blocking peptide (+BP). LNCaP cells expressed a significantly higher abundance of the TRPC1 protein compared with PC-3 cells. (B) Westerns blots showing the expression of a ~100 kDa band labeled by an anti-TRPC3 antibody with different amounts of loaded PC-3 and LNCaP cell membrane proteins (10, 20 and 80 μg) in the absence and presence of the TRPC3 antigenic/blocking peptide (+BP). LNCaP cells expressed significantly higher abundance of TRPC3 protein which was clearly detectable with the lowest protein sample (i.e., 10 μg). In comparison, for PC-3 cells TRPC3 was only detectable in the highest protein loaded lane (i.e., 80 μg). (C) Expression of a ~110 kDa band labeled by an anti-TRPC4 antibody. Again, TRPC4 was present in high abundance in LNCaP cells and detectable at 10 μg protein loaded lane but could not be unequivocal as a specific lane in PC-3 cells even at the highest protein loading level (80 μg). (D) Expression of a 100 kDa band labeled by an anti-TRPC5 antibody was detected in Xenopus oocyte membrane (used as a positive control for the TRPC5 antibody) but a similar band was not detected in either PC-3 and LNCaP cell lanes loaded with the same 60 μg protein/lane. (D, right) Western blots showing a 120 kDa band labeled by anti-TRPC6 antibody was weakly but equally expressed in PC-3 and LNCaP cells membranes.
None
Figure 17. Peak MS currents measured in PC-3 and LNCaP cell sublines in which specific TRPCs had been permanently suppressed or overexpressed are compared with the MS currents measured in the parent cell line (wild type) and the subline transfected with a scrambled RNA. (A) Histogram of MS currents measured in PC-3 cells in wild type and permanently transfected with scrambled RNA and siRNA blocking TRPC1 and TRPC3 expression. There was no significant change in MS currents compared with wild type and scrambled control. MS currents were measured as the peak current in response to an 80 mmHg suction step at -100 mV patch potential with 100 K+/0 Ca2+. The means and SEMs for each condition were PC-3 WT: 23.4 ± 2.82 n = 54; Scrambled-RNA: 19.0 ± 3.56 n = 12; siRNA-TRPC1: 21.4 ± 2.5 n = 35; siRNA-TRPC3: 18.6 ± 1.28 n = 45. (B) Peak MS currents measured in LNCaP parent cell line (WT) and the indicated permanently transfected sublines.

Similar articles

Cited by

References

    1. Pienta KJ, Loberg R. The “emigration, migration, and immigration”of prostate cancer. Clin Prostate Cancer. 2005;4:24–30. - PubMed
    1. Chambers AF, Groom AC, MacDonald IC. Dissemination and growth of cancer cells in metastatic sites. Nat Rev Cancer. 2002;2:563–72. doi: 10.1038/nrc865. - DOI - PubMed
    1. Kassis J, Lauffenburger DA, Turner T, Wells A. Tumor invasion as dysregulated cell motility. Semin Cancer Biol. 2001;11:105–17. doi: 10.1006/scbi.2000.0362. - DOI - PubMed
    1. Lauffenburger DA, Horwitz AF. Cell migration: a physically integrated molecular process. Cell. 1996;84:359–69. doi: 10.1016/S0092-8674(00)81280-5. - DOI - PubMed
    1. Sheetz MP, Felsenfeld D, Galbraith CG, Choquet D. Cell migration as a five-step cycle. Biochem Soc Symp. 1999;65:233–43. - PubMed

Publication types

MeSH terms

LinkOut - more resources