. 2013 Mar;6(2):309-23.
doi: 10.1038/mi.2012.73. Epub 2012 Aug 8.

Altered generation of induced regulatory T cells in the FVB.mdr1a-/- mouse model of colitis

Affiliations

Altered generation of induced regulatory T cells in the FVB.mdr1a-/- mouse model of colitis

S M Tanner et al. Mucosal Immunol. 2013 Mar.

Abstract

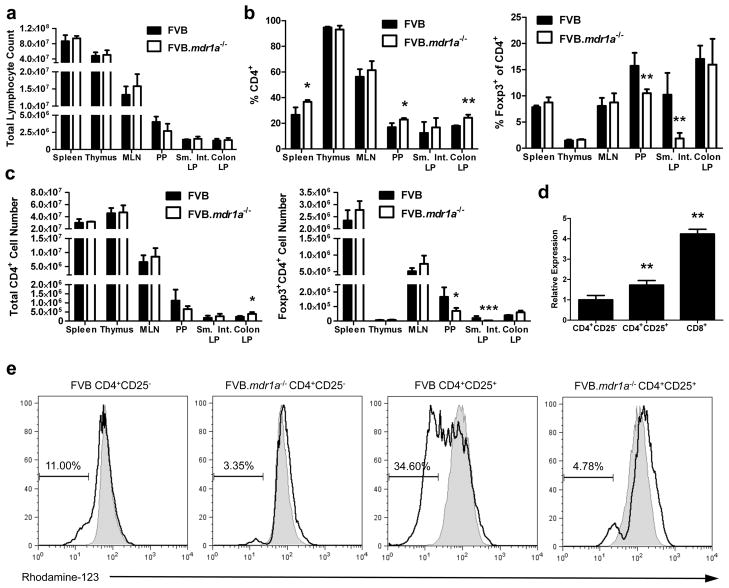
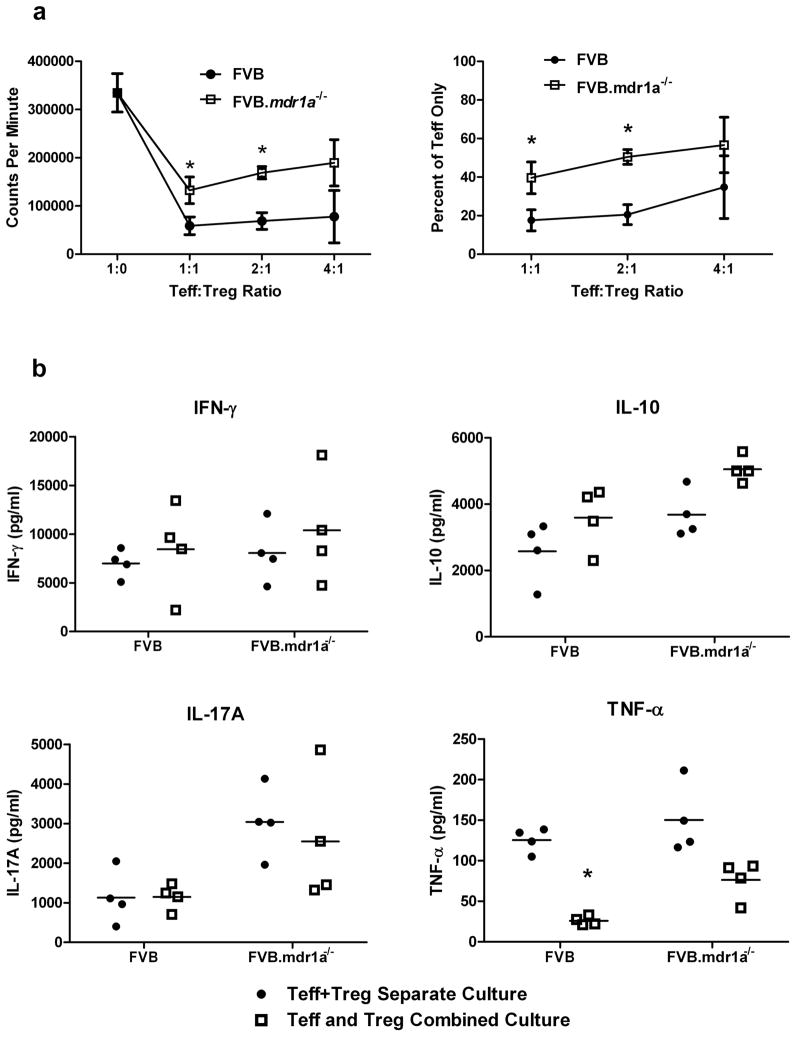
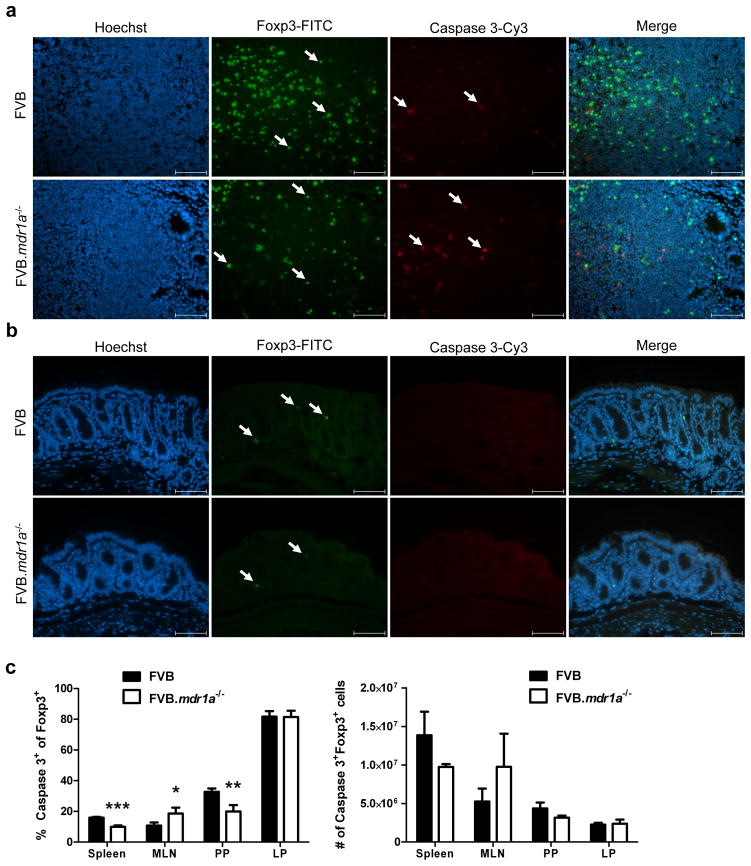
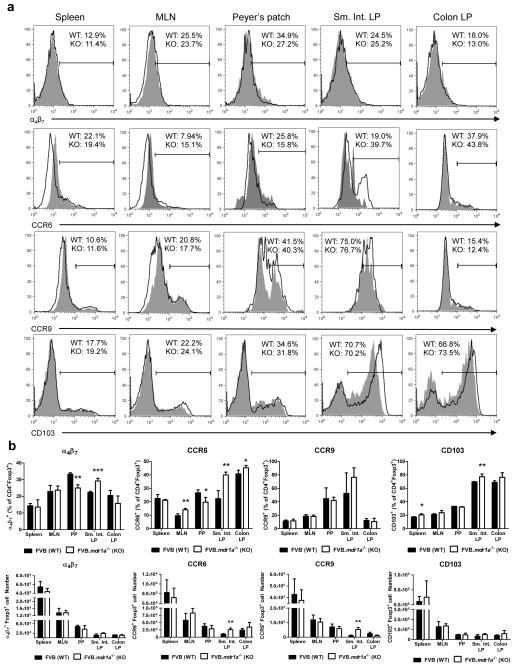
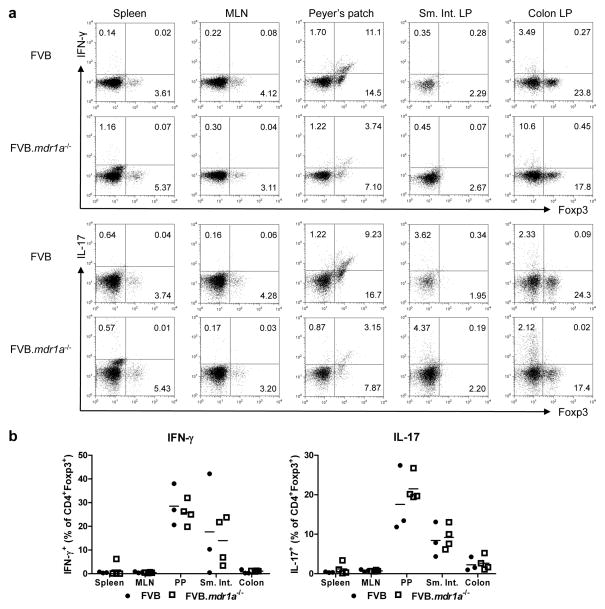
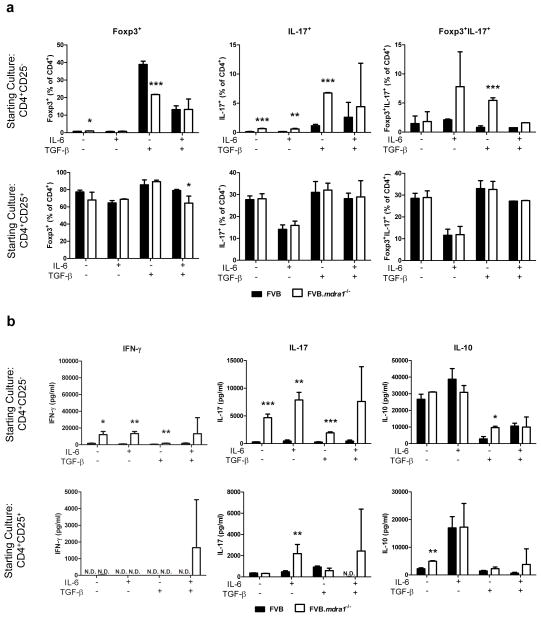
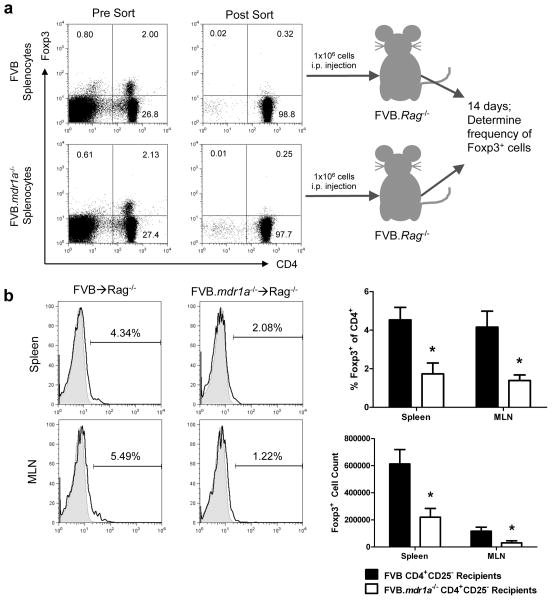
The FVB.mdr1a(-/-) mouse, lacking the small molecule pump P-glycoprotein (P-gp), is a commonly used model for the study of spontaneous T cell-mediated colitis. In addition, MDR1 polymorphisms and P-gp deficiency in humans have been linked to the development of ulcerative colitis. We now demonstrate that mice with P-gp deficiency have decreased levels of Foxp3(+) regulatory T cells (Tregs) in the intestinal lamina propria. This decrease is not due to either increased Treg apoptosis, altered Treg trafficking, or enhanced Treg plasticity to become Foxp3(+)IL-17(+) cells. Instead, P-gp deficiency appears to restrict the development of induced Treg cells (iTregs), as fewer Foxp3(+) iTregs developed from naive FVB.mdr1a(-/-) T cells both upon transforming growth factor-β (TGF-β) treatment in vitro and after adoptive transfer into FVB.rag2(-/-) recipients. Rather, in vitro TGF-β treatment results in a IL-17(+)CD4(+) T cell. This failure of iTregs to develop explains the decrease in Foxp3(+) Tregs in the FVB.mdr1a(-/-) intestine, representing a need to investigate this novel disease mechanism in human inflammatory bowel disease patients with MDR1 polymorphisms.


Conflict of interest statement

The authors declare no conflict of interest.

DISCLOSURE

The authors declare no conflict of interest.

Figures

Figure 1
Figure 1
CD4+CD25+ cells express P-glycoprotein and FVB.mdr1a−/− mice display a smaller percentage of CD4+Foxp3+ Treg cells in intestinal lymphoid tissues. (a) Total cell lymphocyte counts after cell isolation. (b) Total percentage of CD4+ and Foxp3+CD4+ cells from FVB and FVB.mdr1a−/− spleen, MLN, Peyer’s patches (PP), and small intestinal (Sm. Int.) or colonic lamina propria (LP). Cells were collected from tissues and rested overnight prior to staining and flow cytometry. (c) Total cell numbers of CD4+ or CD4+Foxp3+ cells within each population. (d) RNA expression of Abcb1a (P-gp) in splenic CD4+CD25 (set as a relative value of 1.0), CD4+CD25+, and CD8+ (known to express P-gp) splenocytes. (e) P-gp functional expression on CD4+CD25 and CD4+CD25+ cells. MACS isolated cells were loaded with the P-gp specific substrate rhodamine-123 (R123) for 1 hour, followed by a 1 hour flux of R123. Shaded region represents loading control, while solid line indicates fluxed sample. Percentages indicate percent of cells fluxing R123 through P-gp activity. Small amount of flux is a result of free diffusion of R123 across cell membrane. Data are representative of 2 (d) or 3 (a, b, and c) separate experiments, with 3–4 male mice, 6–8 weeks of age in each group per experiment. * P ≤ 0.05; ** P ≤ 0.01. Mean + standard deviation shown.
Figure 2
Figure 2
FVB.mdr1a−/− CD4+CD25+ Treg cells suppress CD4+CD25 Teff proliferation in vitro, but fail to suppress TNF-α secretion. (a) MACS isolated FVB CD4+CD25 (Teff) and CD4+CD25+ (Treg) cells from either FVB or FVB.mdr1a−/− were cultured either separately or cultured together for 96 hours in the presence of anti-CD3 and anti-CD28. 3H-Thymidine was added for the final 24 hours of culture. Assay was done at 1:1, 2:1, and 4:1 Teff:Treg ratio as indicated. (b) Supernatants from a were collected after 72 hours and prior to the addition 3H-Thymidine. Cytokine concentrations were determined using multiplex kits. Data are representative of 3 separate experiments, with 3–4 male mice, 6–8 weeks of age in each group per experiment. * P ≤ 0.05; ** P ≤ 0.01; *** P ≤ 0.001. Mean + standard deviation (a) or standard error of the mean (b) shown.
Figure 3
Figure 3
Intestinal FVB.mdr1a−/− Foxp3+ cells do not have increased levels of apoptosis. (a) Sections of Peyer’s patches and (b) distal colon were stained for Foxp3 and cleaved caspase-3. Positive cells for stains are indicated by arrows in their respective panels. Images were captured at 40× magnification, and scale bars = 20 μm. (c) Cells were isolated from spleen, MLN, PP, and intestinal LP and stimulated for 18 hours with 10 μg/ml anti-CD95 to induce apoptosis. Cells were then stained for CD4, Foxp3 and cleaved caspase-3. Lymphocytes were gated based on forward scatter/side scatter. Cells were pre-gated on CD4+ cells prior to analysis of Foxp3 and cleaved caspase 3 expression. Note that the high number of apoptotic cells in the LP may be a result of the extensive enzymatic digesting necessary to isolate these cells. Data are shown from one experiment, but are representative of 2 separate experiments, with 3–4 male mice, 6–8 weeks of age in each group per experiment. * P ≤ 0.05; ** P ≤ 0.01; *** P ≤ 0.001. Mean + standard deviation shown.
Figure 4
Figure 4
Altered trafficking of CD4+Foxp3+ Tregs does not account for the decreased levels of Tregs in the FVB.mdr1a−/− intestines. (a) Representative FACS histogram plots for α4β7, CCR6, CCR9, and CD103 expression on CD4+Foxp3+ Tregs in spleen, MLN, PP, small intestinal LP and colonic LP. Cells were isolated from tissues and rested overnight prior to staining. Lymphocytes were gated on based on forward scatter/side scatter and then subsequently gated on CD4+Foxp3+ cells. Percentages shown are for only this representative FACS plot, shaded region = FVB, Solid line = FVB.mdr1a−/−. (b) Histograms representing the mean percentages (upper panels) and cell counts (lower panels) from analysis of each individual histogram gated on CD4+Foxp3+ as represented in a. Data shown are the means from one representative experiment, which was repeated twice. Each experiment individually analyzed, 3–4 male mice, 6–8 weeks of age. * P ≤ 0.05; ** P ≤ 0.01; *** P ≤ 0.001. Mean + standard deviation shown.
Figure 5
Figure 5
FVB.mdr1a−/− CD4+Foxp3+ cells do not have higher co-expression of IFN-γ or IL-17 in the intestines. (a) Representative FACS plots of Foxp3 vs IFN-γ or Foxp3 vs IL-17A in spleen, MLN, PP, small intestinal LP, and colonic LP. Cells were isolated from tissues and rested overnight prior to stimulation with PMA and ionomycin in the presence of monensin. Cells were then stained for CD4, Foxp3, IFN-γ and IL-17. Lymphocytes were gated on based on forward scatter/side scatter and subsequently gated on CD4+ cells. (b) Dot plots representing the individual mice and the mean from one representative experiment. Data was reproduced in 3 separate experiments with 3 mice male mice (6–8 weeks of age) per group. Mean + standard deviation shown.
Figure 6
Figure 6
FVB.mdr1a−/− CD4+CD25 cells do not become Foxp3+ cells upon treatment with TGF-β and are more likely to become Foxp3IL-17+ cells. (a) MACS isolated CD4+CD25 (upper panels) and CD4+CD25+ (lower panels) cells were cultured for 72 hours with CD3 and CD28 stimulation in the presence of 25 ng/ml IL-6 alone, 5 ng/ml TGF-β alone, or IL-6 and TGF-β together. Cells were rested for 24 hours, then subsequently stained for CD4, Foxp3, and IL-17. (b) Supernatants from a were collected after 72 hours of culture and analyzed for IL-10, IL-17, and IFN-γ secretion by ELISA. It is important to note that freshly isolated splenic CD4+Foxp3 (and CD4+Foxp3+) cells from FVB and FVB.mdr1a−/− express similar levels of the activation markers CD44, CD62L, and CD69, indicating that the activation states of these cells is the same (data not shown). Results are representative of 2 independent experiments, with 3–4 male mice, 6–8 weeks of age in each group per experiment. N.D. = not detected (below detectable level of assay). * P ≤ 0.05; **, P ≤ 0.01; ***, P ≤ 0.001. Mean of 3–4 mice (analyzed separately) + standard deviation shown.
Figure 7
Figure 7
FVB.mdr1a−/− CD4+CD25 cells show impaired Foxp3+ iTreg generation in vivo. (a) An schematic of the adoptive transfer experiment. Splenocytes from FVB and FVB.mdr1a−/− mice were stained for CD4 and CD25, and subsequently isolated via FACS cell sorting. Representative pre-sort (left panels) and post-sort (right panels) are shown for both FVB and FVB.mdr1a−/−. 1×10⁶ CD4+CD25 cells were then injected i.p. into FVB.Rag2−/− recipients. After 14 days, the spleen, MLN and intestinal lamina propria was harvested from the recipients. (b) Foxp3+ expression on the gated CD4+ population of spleen and MLN of FVB.Rag2−/− recipients 14 days after adoptive transfer. * P ≤ 0.01. Mean of 6 recipient mice per group + standard deviation shown.

Similar articles

Cited by

References

    1. Panwala CM, Jones JC, Viney JL. A novel model of inflammatory bowel disease: mice deficient for the multiple drug resistance gene, mdr1a, spontaneously develop colitis. J Immunol. 1998;161:5733–5744. - PubMed
    1. Maggio-Price L, et al. Dual infection with Helicobacter bilis and Helicobacter hepaticus in p-glycoprotein-deficient mdr1a−/− mice results in colitis that progresses to dysplasia. Am J Pathol. 2005;166:1793–1806. - PMC - PubMed
    1. Schinkel AH, et al. Disruption of the mouse mdr1a P-glycoprotein gene leads to a deficiency in the blood-brain barrier and to increased sensitivity to drugs. Cell. 1994;77:491–502. - PubMed
    1. Smyth MJ, Krasovskis E, Sutton VR, Johnstone RW. The drug efflux protein, P-glycoprotein, additionally protects drug-resistant tumor cells from multiple forms of caspase-dependent apoptosis. Proc Natl Acad Sci U S A. 1998;95:7024–7029. - PMC - PubMed
    1. Johnstone RW, Cretney E, Smyth MJ. P-glycoprotein protects leukemia cells against caspase-dependent, but not caspase-independent, cell death. Blood. 1999;93:1075–1085. - PubMed

Publication types

MeSH terms

Substances