. 2012 Dec;31(12):2194-204.
doi: 10.1109/TMI.2012.2211378. Epub 2012 Aug 2.

Penalized likelihood PET image reconstruction using patch-based edge-preserving regularization

Affiliations

Penalized likelihood PET image reconstruction using patch-based edge-preserving regularization

Guobao Wang et al. IEEE Trans Med Imaging. 2012 Dec.

Abstract

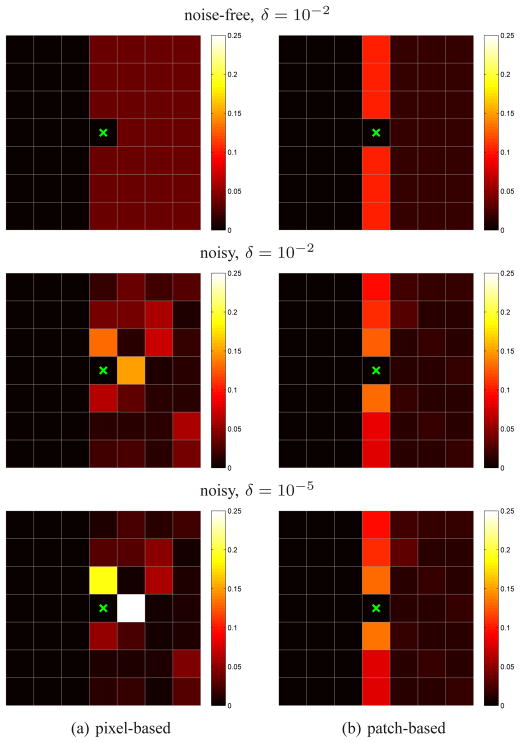
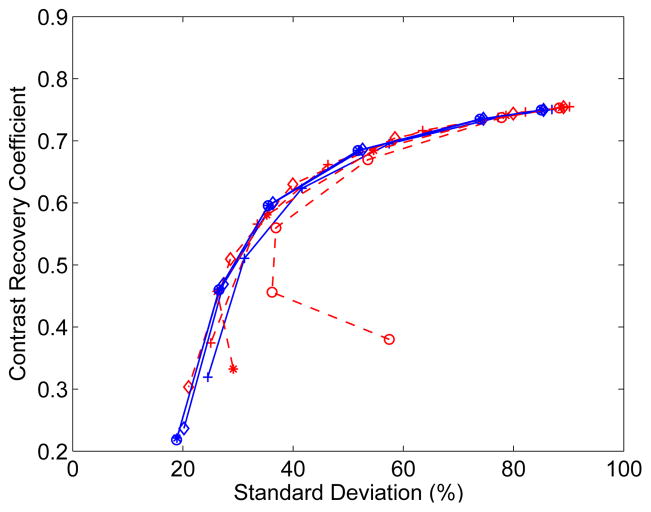
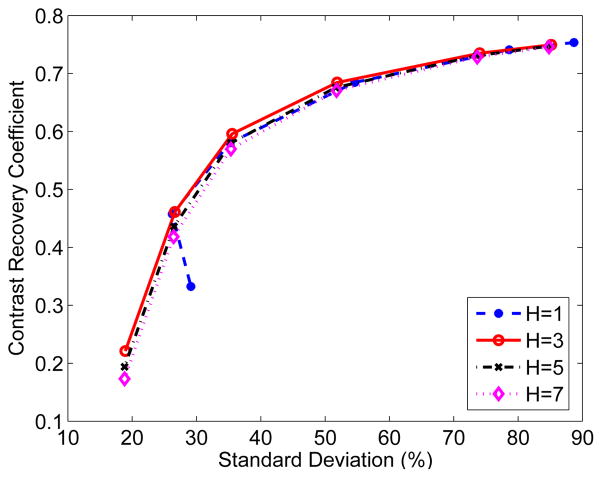
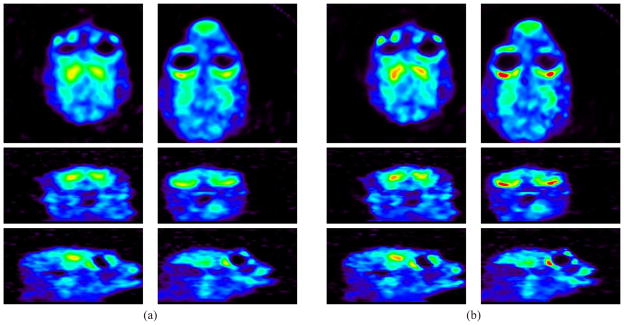
Iterative image reconstruction for positron emission tomography (PET) can improve image quality by using spatial regularization that penalizes image intensity difference between neighboring pixels. The most commonly used quadratic penalty often oversmoothes edges and fine features in reconstructed images. Nonquadratic penalties can preserve edges but often introduce piece-wise constant blocky artifacts and the results are also sensitive to the hyper-parameter that controls the shape of the penalty function. This paper presents a patch-based regularization for iterative image reconstruction that uses neighborhood patches instead of individual pixels in computing the nonquadratic penalty. The new regularization is more robust than the conventional pixel-based regularization in differentiating sharp edges from random fluctuations due to noise. An optimization transfer algorithm is developed for the penalized maximum likelihood estimation. Each iteration of the algorithm can be implemented in three simple steps: an EM-like image update, an image smoothing and a pixel-by-pixel image fusion. Computer simulations show that the proposed patch-based regularization can achieve higher contrast recovery for small objects without increasing background variation compared with the quadratic regularization. The reconstruction is also more robust to the hyper-parameter than conventional pixel-based nonquadratic regularizations. The proposed regularization method has been applied to real 3-D PET data.


Figures

Fig. 1
Fig. 1
The noise-free and noisy edge images. Pixel j is marked by ‘×’.
Fig. 2
Fig. 2
Images of the weights wjk in the pixel-based regularization and patch-based regularization with different δ values for the noise-free and noisy step images shown in Fig. 1. The jth pixel is marked by ‘×’.
Fig. 3
Fig. 3
(a) The original phantom image with a marker line going through the tumor spot horizontally. (b–i) Reconstructed images by the ML-EM with 20 iterations (b), quadratic regularization with β = 0.1 (c), pixel-based Lange regularization (d–f), and patch-based Lange regularization (g–i). The smoothing regularization parameter β is 0.2 for the pixel and patch Lange regularizations.
Fig. 4
Fig. 4
Intensity profiles along the horizontal line through the tumor as indicated in Fig. 3(a). The reconstruction methods and corresponding parameters are the MLEM algorithm with 20 iterations, the quadratic regularization (β = 0.1), the pixel Lange regularization (β = 0.2, δ = 0.01), and the patch Lange regularization (β = 0.2, δ = 0.01).
Fig. 5
Fig. 5
The tumor contrast recovery versus background standard deviation curves for the quadratic regularization and patch-based regularization. The curves are plotted by varying the regularization parameter β.
Fig. 6
Fig. 6
The tumor contrast recovery versus background standard deviation curves of the pixel-based (dash lines) and patch-based (solid lines) Lange regularizations. The curves are plotted by varying the smoothing parameter β for different hyper-parameter δ values: δ = 1.0 (+),δ = 0.1 (◇), δ = 0.01 (*),δ = 0.001 (○).
Fig. 7
Fig. 7
The tumor contrast recovery versus background standard deviation curves of the patch regularization with different neighborhood sizes. Curves are plotted by varying the regularization parameter β.
Fig. 8
Fig. 8
The tumor contrast recovery versus background standard deviation curves of the patch regularization with different patch sizes. Curves are plotted by varying the regularization parameter β.
Fig. 9
Fig. 9
Effect of (a) neighborhood window size W and (b) patch size H on the tumor contrast recovery versus background noise curve of the patch-based regularization at 150k count level.
Fig. 10
Fig. 10
Reconstructed images of the real 3D primate data using (a) the quadratic regularization and (b) the patch regularization. Transverse, coronal and sagittal slices are shown in row 1, 2 and 3, respectively. The left column in (a) and (b) shows the slices through the striatum regions and the right column shows the slices through the gland regions.
Fig. 11
Fig. 11
The ten spherical ROIs drawn in the brain background.
Fig. 12
Fig. 12
Comparison of the mean and standard deviation of the activities inside (a) the background ROIs and (b) the high-uptake ROIs.

References

    1. Qi J, Leahy RM. Iterative reconstruction techniques in emission computed tomography. Physics in Medicine and Biology. 2006;51(15):R541–578. - PubMed
    1. Buades A, Coll B, Morel JM. Technical Report. Vol. 22. CMLA; 2006. Image enhancement by non-local reverse heat equation.
    1. Gilboa G, Osher S. Nonlocal linear image regularization and supervised segmentation. SIAM Multiscale Modeling and Simulation. 2007;6(2):595–630.
    1. Gilboa G, Osher S. Nonlocal operators with applications to image processing. SIAM Multiscale Modeling and Simulation. 2008;7(3):1005–1028.
    1. Kindermann S, Osher S, Jones P. Deblurring and denoising of images by nonlocal functionals. SIAM Multiscale Modeling and Simulation. 2005;4(4):1091–1115.

Publication types