. 2012 Oct;86(20):10950-60.
doi: 10.1128/JVI.05992-11. Epub 2012 Aug 8.

Filamentous influenza virus enters cells via macropinocytosis

Affiliations

Filamentous influenza virus enters cells via macropinocytosis

Jeremy S Rossman et al. J Virol. 2012 Oct.

Abstract

Influenza virus is pleiomorphic, producing both spherical (100-nm-diameter) and filamentous (100-nm by 20-μm) virions. While the spherical virions are known to enter host cells through exploitation of clathrin-mediated endocytosis, the entry pathway for filamentous virions has not been determined, though the existence of an alternative, non-clathrin-, non-caveolin-mediated entry pathway for influenza virus has been known for many years. In this study, we confirm recent results showing that influenza virus utilizes macropinocytosis as an alternate entry pathway. Furthermore, we find that filamentous influenza viruses use macropinocytosis as the primary entry mechanism. Virions enter cells as intact filaments within macropinosomes and are trafficked to the acidic late-endosomal compartment. Low pH triggers a conformational change in the M2 ion channel protein, altering membrane curvature and leading to a fragmentation of the filamentous virions. This fragmentation may enable more-efficient fusion between the viral and endosomal membranes.


Figures

Fig 1
Fig 1
Influenza viruses utilize macropinocytosis as an alternate entry pathway. (a) The percentage of infected MDCK cells was determined by an assessment of NP expression following infection with 1 MOI of A/Udorn/72 for 7 h at 37°C in the presence or absence of the indicated inhibitors. Inhibitors were used at the following concentrations: ammonium chloride (AmCl2), 20 mM; chlorpromazine (CPZ), 15 μg/ml; EIPA, 50 μM; IPA3, 10 μM. Values were normalized to the percentage of infected, untreated cells. (b) MDCK cells were pretreated with CPZ at 15 μg/ml for 1 h at 37°C, pulsed with 0.5 mg/ml fluorescently labeled transferrin, and incubated for 1 h at 37°C. Cells were then fixed, and the percentage of transferrin-positive cells was quantified and normalized to the percentage of untreated cells. (c) The percentage of infected MDCK cells was determined as in panel a and normalized to the percentage of infected, CPZ-treated cells. Inhibitors were used at the following concentrations: ammonium chloride (AmCl2), 20 mM; bisindolylmaleimide (bis), 20 μM; blebbistatin (bleb), 100 μM; chlorpromazine (CPZ), 15 μg/ml; cytochalasin D (cytoD), 0.5 μg/ml; dynasore (dyna), 80 μM; EIPA, 50 μM; Clostridium botulinum C3 exotoxin (exoC3), 1 μg/ml; IPA3, 10 μM; methyl-β-cyclodextrin (MβCD), 10 mM; nocodazole (noc), 10 μg/ml; Rac1 inhibitor (rac1ini), 100 μM; Clostridium difficile toxin B (toxB), 300 ng/ml; wortmannin (wort), 1 μM. All single-inhibitor treatments except cytoD showed a significant difference from untreated cells, and all samples with CPZ added (+CPZ) showed a significant difference from CPZ-only-treated cells, as determined by the Student t test (P ≤ 0.05). Note: the data shown in panel a have been included in this full data set to facilitate comparison of the different treatment conditions. (d) MDCK cells were treated with the indicated inhibitors for 4 h at 37°C, alamarBlue cell viability reagent was then added in the presence of the inhibitors, and the cells were incubated for a further 4 h. Cell viability was assessed by quantifying alamarBlue fluorescence. (e) 293T cells were transfected with the indicated DN plasmids or mock-transfected with an empty vector control plasmid, and the percentage of infected cells was determined following 8 h of infection with 1 MOI of A/Udorn/72 or A/WSN/33, as in panel a. Values are means ± SDs. *, significant difference from untreated cells as determined by the Student t test (P ≤ 0.05); **, significant difference from CPZ- or Epsin1-DN-treated cells as determined by the Student t test (P ≤ 0.05).
Fig 2
Fig 2
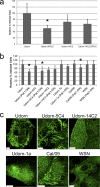
Filamentous influenza viruses enter cells via macropinocytosis. (a) The percentage of infected MDCK cells was determined following infection with 1 MOI for 8 h. Cells were infected with A/Udorn/72 or with A/Udorn/72 that had been pretreated with MAb-14C2 at 37°C for 1 h before infection. Values were normalized to the percentage of infected, untreated cells. (b) The percentage of infected transfected 293T cells was determined following infection with 1 MOI for 8 h, performed as described above. Cells were infected with either A/Udorn/72, MAb-5C4-treated A/Udorn/72, MAb-14C2-treated A/Udorn/72, A/California/09, or A/WSN/33. Values are means ± SDs. *, significant difference from untreated cells as determined by the Student t test (P ≤ 0.05). (c) Morphology of relevant influenza virus strains was determined following infection of MDCK cells with either A/Udorn/72, A/Udorn/72-1a, A/California/09, or A/WSN/33. Cells were infected at 3 MOI for 18 h before fixation, immunofluorescent staining for HA, and imaging by confocal microscopy. Scale bars, 10 μm.
Fig 3
Fig 3
Influenza viruses induce macropinocytosis independently of viral morphology. MDCK cells were incubated in a suspension with 3 MOI of the indicated virus and 1 mg/ml of dextran-Alexa 488. After 15 min at 37°C, the cells were washed and fixed, and the amount of internalized dextran was measured by flow cytometry. Each experiment was performed in duplicate, and the results shown are the averages of 2 separate experiments. *, significant difference from untreated cells as determined by the Student t test (P ≤ 0.05).
Fig 4
Fig 4
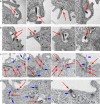
Induction of macropinocytosis by filamentous influenza virions. (a and b) A549 cells were infected with 10 MOI of A/Udorn/72 for 15 min or 2 h in the presence of 10 μM AmCl2, fixed, and processed for viewing by thin-section electron microscopy. (a) Virus engulfment during macropinocytosis. (b) Internalized virus located within the macropinosome. (c and d) Virus internalization was performed as described above for 20 min in the presence of gold-labeled dextran (c) or HRP (d). Arrows indicate virions undergoing macropinocytosis. Arrowheads indicate the fluid-phase markers Au-dextran and the HRP-DAB reaction product. (e) A549 cells were infected with 10 MOI of A/WSN/33 for 20 min and processed as described above. The arrow indicates a virion undergoing clathrin-mediated endocytosis. The arrowhead indicates the clathrin lattice. Scale bars, 100 nm.
Fig 5
Fig 5
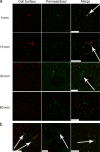
Filamentous influenza virions fragment during cell entry. (a) MDCK cells were infected with 10 MOI of A/Udorn/72 for the times indicated at 37°C and stained for intracellular (shown in green) and extracellular (shown in red) virions. (b) Additional examples of merged images from the 30-min time point shown in panel a. Scale bars, 10 μm. Arrows indicate filamentous virions.
Fig 6
Fig 6
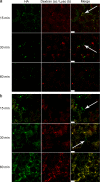
Filamentous influenza viruses fragment upon trafficking to the endolysosomal compartment. (a) MDCK cells were infected with 10 MOI of A/Udorn/72 for the times indicated at 37°C with 0.5 mg/ml 10-kDa dextran-Alexa-488 (shown in red), fixed, and stained for HA (shown in green). (b) MDCK cells were infected with 10 MOI of A/Udorn/72 in the presence of the lysosome marker LysoTracker (shown in red) for the times indicated, fixed, and stained for HA (shown in green). Scale bars, 10 μm. Arrows indicate filamentous virions. Note: to allow for better assessment of colocalization, the intensity of dextran-Alexa-488 and LysoTracker was increased postimaging via an equal adjustment of image levels across all panels in the figure.
Fig 7
Fig 7
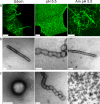
Opening of the M2 ion channel causes a fragmentation of filamentous influenza virions. (a) MDCK cells were infected with 3 MOI of A/Udorn/72 for 17 h at 37°C, treated with pH 7.5 buffer, pH 5.5 buffer, or pH 5.5 buffer with 10 μM amantadine (Am) for 1 h at 37°C, fixed, and stained for HA. Scale bars, 10 μm. (b) Supernatant from a 48-h infection of MDCK cells with 0.001 MOI of A/Udorn/72 was treated as described above and processed for transmission electron microscopy. (c) Additional examples of pH 5.5-treated filaments as described in panel b, showing filaments in the process of fragmenting as well as the resulting disperse, spherical-like particles primarily generated from the treatment. Scale bars, 100 nm.
Fig 8
Fig 8
Low pH induces M2 conformational changes. Control, M2-containing, or M2-helix-containing LUVs were treated with MAb-14C2, control MAb-5C4, pH 5.5 buffer, or pH 5.5 buffer with 10 μm amantadine for 1 h at 37°C and processed for transmission electron microscopy. Scale bars, 50 nm.

References

    1. Ada GL, Perry BT, Abbot A. 1958. Biological and physical properties of the Ryan strain of filamentous influenza virus. J. Gen. Microbiol. 19:23–39 - PubMed
    1. Alexander A. 1998. Endocytosis and intracellular sorting of receptor tyrosine kinases. Front. Biosci. 3:d729–d738 - PubMed
    1. Bar-Sagi D, Hall A. 2000. Ras and Rho GTPases: a family reunion. Cell 103:227–238 - PubMed
    1. Bourmakina SV, Garcia-Sastre A. 2003. Reverse genetics studies on the filamentous morphology of influenza A virus. J. Gen. Virol. 84:517–527 - PubMed
    1. Burnet FM, Lind PE. 1957. Studies on filamentary forms of influenza virus with special reference to the use of dark-ground-microscopy. Arch. Gesamte Virusforsch. 7:413–422 - PubMed

Publication types

Substances

LinkOut - more resources