

Alternative protein-protein interfaces are frequent exceptions
- PMID: 22876170
- PMCID: PMC3410849
- DOI: 10.1371/journal.pcbi.1002623
Alternative protein-protein interfaces are frequent exceptions
Abstract
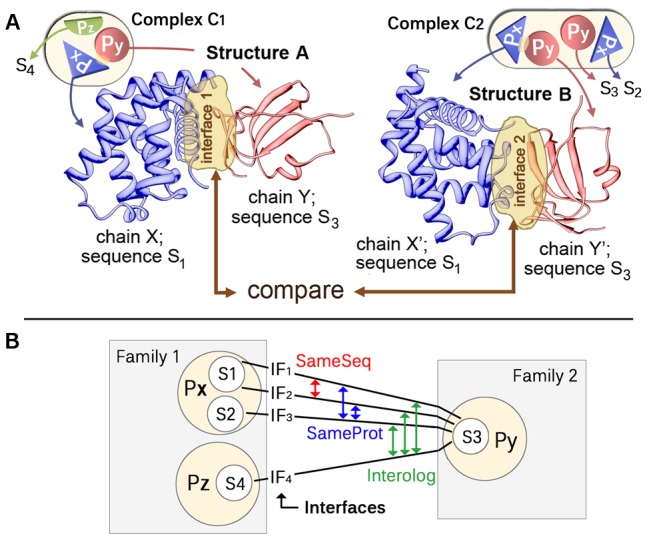
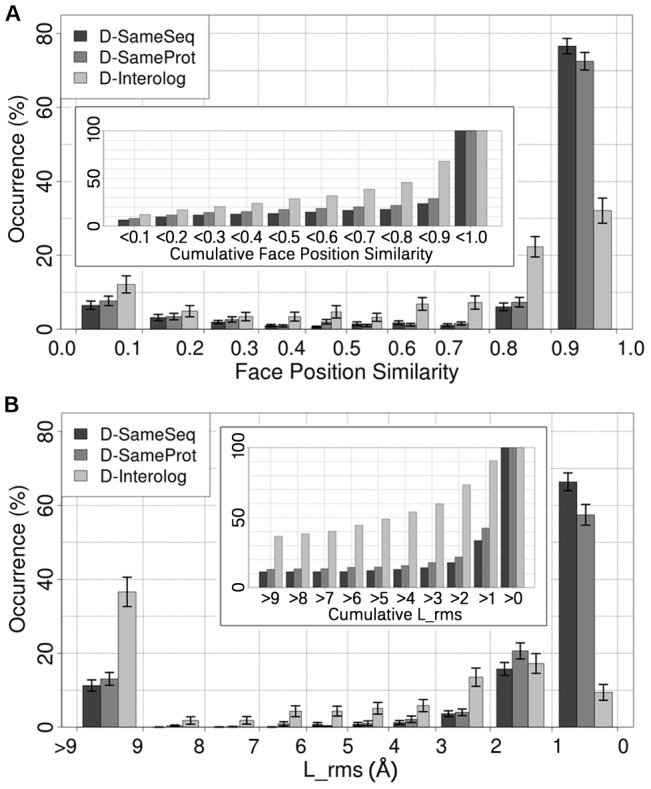
The intricate molecular details of protein-protein interactions (PPIs) are crucial for function. Therefore, measuring the same interacting protein pair again, we expect the same result. This work measured the similarity in the molecular details of interaction for the same and for homologous protein pairs between different experiments. All scores analyzed suggested that different experiments often find exceptions in the interfaces of similar PPIs: up to 22% of all comparisons revealed some differences even for sequence-identical pairs of proteins. The corresponding number for pairs of close homologs reached 68%. Conversely, the interfaces differed entirely for 12-29% of all comparisons. All these estimates were calculated after redundancy reduction. The magnitude of interface differences ranged from subtle to the extreme, as illustrated by a few examples. An extreme case was a change of the interacting domains between two observations of the same biological interaction. One reason for different interfaces was the number of copies of an interaction in the same complex: the probability of observing alternative binding modes increases with the number of copies. Even after removing the special cases with alternative hetero-interfaces to the same homomer, a substantial variability remained. Our results strongly support the surprising notion that there are many alternative solutions to make the intricate molecular details of PPIs crucial for function.
Conflict of interest statement
The authors have declared that no competing interests exist.
Figures


Similar articles
-
Structural similarity and classification of protein interaction interfaces.PLoS One. 2011 May 12;6(5):e19554. doi: 10.1371/journal.pone.0019554. PLoS One. 2011. PMID: 21589874 Free PMC article.
-
Survey of the geometric association of domain-domain interfaces.Proteins. 2005 Dec 1;61(4):1075-88. doi: 10.1002/prot.20693. Proteins. 2005. PMID: 16247798
-
Unraveling the structural landscape of intra-chain domain interfaces: Implication in the evolution of domain-domain interactions.PLoS One. 2019 Aug 2;14(8):e0220336. doi: 10.1371/journal.pone.0220336. eCollection 2019. PLoS One. 2019. PMID: 31374091 Free PMC article.
-
Prediction of protein-protein interactions: unifying evolution and structure at protein interfaces.Phys Biol. 2011 Jun;8(3):035006. doi: 10.1088/1478-3975/8/3/035006. Epub 2011 May 13. Phys Biol. 2011. PMID: 21572173 Review.
-
Structural motifs at protein-protein interfaces: protein cores versus two-state and three-state model complexes.Protein Sci. 1997 Sep;6(9):1793-805. doi: 10.1002/pro.5560060901. Protein Sci. 1997. PMID: 9300480 Free PMC article. Review.
Cited by
-
Structure and dynamics of molecular networks: a novel paradigm of drug discovery: a comprehensive review.Pharmacol Ther. 2013 Jun;138(3):333-408. doi: 10.1016/j.pharmthera.2013.01.016. Epub 2013 Feb 4. Pharmacol Ther. 2013. PMID: 23384594 Free PMC article. Review.
-
Protein Interaction Z Score Assessment (PIZSA): an empirical scoring scheme for evaluation of protein-protein interactions.Nucleic Acids Res. 2019 Jul 2;47(W1):W331-W337. doi: 10.1093/nar/gkz368. Nucleic Acids Res. 2019. PMID: 31114890 Free PMC article.
-
Multiple claudin-claudin cis interfaces are required for tight junction strand formation and inherent flexibility.Commun Biol. 2018 May 17;1:50. doi: 10.1038/s42003-018-0051-5. eCollection 2018. Commun Biol. 2018. PMID: 30271933 Free PMC article.
-
Graph masked self-distillation learning for prediction of mutation impact on protein-protein interactions.Commun Biol. 2024 Oct 26;7(1):1400. doi: 10.1038/s42003-024-07066-9. Commun Biol. 2024. PMID: 39462102 Free PMC article.
-
Performance of computational methods for the evaluation of pericentriolar material 1 missense variants in CAGI-5.Hum Mutat. 2019 Sep;40(9):1474-1485. doi: 10.1002/humu.23856. Epub 2019 Aug 17. Hum Mutat. 2019. PMID: 31260570 Free PMC article.
References
-
- Kendrew JC, Dickerson RE, Strandberg BE, Hart RJ, Davies DR, et al. (1960) Structure of Myoglobin: A Three-Dimensional Fourier Synthesis at 2 Å Resolution. Nature 185: 422–427. - PubMed
-
- Perutz MF, Rossmann MG, Cullis AF, Muirhead G, Will G, et al. (1960) Structure of Haemoglobin: A Three-Dimensional Fourier Synthesis at 5.5 Å Resolution, Obtained by X-ray Analysis. Nature 185: 416–422. - PubMed
-
- Dutta S, Berman HM (2005) Large Macromolecular Complexes in the Protein Data Bank: A Status Report. Structure 13: 381–388. - PubMed
-
- Taylor IW, Linding R, Warde-Farley D, Liu YM, Pesquita C, et al. (2009) Dynamic Modularity in Protein Interaction Networks Predicts Breast Cancer Outcome. Nat Biotechnol 27: 199–204. - PubMed
Publication types
MeSH terms
Substances
LinkOut - more resources
Full Text Sources
