The metabochip, a custom genotyping array for genetic studies of metabolic, cardiovascular, and anthropometric traits
- PMID: 22876189
- PMCID: PMC3410907
- DOI: 10.1371/journal.pgen.1002793
The metabochip, a custom genotyping array for genetic studies of metabolic, cardiovascular, and anthropometric traits
Erratum in
- PLoS Genet. 2013 Apr;9(4). doi: 10.1371/annotation/0b4e9c8b-35c5-4dbd-b95b-0640250fbc87 doi: 10.1371/annotation/0b4e9c8b-35c5-4dbd-b95b-0640250fbc87
Abstract
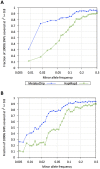
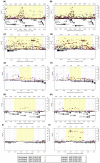
Genome-wide association studies have identified hundreds of loci for type 2 diabetes, coronary artery disease and myocardial infarction, as well as for related traits such as body mass index, glucose and insulin levels, lipid levels, and blood pressure. These studies also have pointed to thousands of loci with promising but not yet compelling association evidence. To establish association at additional loci and to characterize the genome-wide significant loci by fine-mapping, we designed the "Metabochip," a custom genotyping array that assays nearly 200,000 SNP markers. Here, we describe the Metabochip and its component SNP sets, evaluate its performance in capturing variation across the allele-frequency spectrum, describe solutions to methodological challenges commonly encountered in its analysis, and evaluate its performance as a platform for genotype imputation. The metabochip achieves dramatic cost efficiencies compared to designing single-trait follow-up reagents, and provides the opportunity to compare results across a range of related traits. The metabochip and similar custom genotyping arrays offer a powerful and cost-effective approach to follow-up large-scale genotyping and sequencing studies and advance our understanding of the genetic basis of complex human diseases and traits.
Conflict of interest statement
The authors have declared that no competing interests exist.
Figures


References
Publication types
MeSH terms
Grants and funding
- R56 DK062370/DK/NIDDK NIH HHS/United States
- U01 HG006513/HG/NHGRI NIH HHS/United States
- U01 HG005214/HG/NHGRI NIH HHS/United States
- R01 HG000376/HG/NHGRI NIH HHS/United States
- T32 HG000040/HG/NHGRI NIH HHS/United States
- R56 HG000376/HG/NHGRI NIH HHS/United States
- R01 DK062370/DK/NIDDK NIH HHS/United States
- 090532/WT_/Wellcome Trust/United Kingdom
- P30 DK020572/DK/NIDDK NIH HHS/United States
- HG005581/HG/NHGRI NIH HHS/United States
- RC2 HG005581/HG/NHGRI NIH HHS/United States
- N01-AG-1-2109/AG/NIA NIH HHS/United States
- BHF_/British Heart Foundation/United Kingdom
- G0600717/MRC_/Medical Research Council/United Kingdom
- 064890/WT_/Wellcome Trust/United Kingdom
- U01 DK062370/DK/NIDDK NIH HHS/United States
- DK062370/DK/NIDDK NIH HHS/United States
- HG005214/HG/NHGRI NIH HHS/United States
- MC_U106188470/MRC_/Medical Research Council/United Kingdom
- 098051/WT_/Wellcome Trust/United Kingdom
- 081682/WT_/Wellcome Trust/United Kingdom
- HG000376/HG/NHGRI NIH HHS/United States
LinkOut - more resources
Full Text Sources
Molecular Biology Databases

