

Inheritance beyond plain heritability: variance-controlling genes in Arabidopsis thaliana
- PMID: 22876191
- PMCID: PMC3410891
- DOI: 10.1371/journal.pgen.1002839
Inheritance beyond plain heritability: variance-controlling genes in Arabidopsis thaliana
Abstract
The phenotypic effect of a gene is normally described by the mean-difference between alternative genotypes. A gene may, however, also influence the phenotype by causing a difference in variance between genotypes. Here, we reanalyze a publicly available Arabidopsis thaliana dataset [1] and show that genetic variance heterogeneity appears to be as common as normal additive effects on a genomewide scale. The study also develops theory to estimate the contributions of variance differences between genotypes to the phenotypic variance, and this is used to show that individual loci can explain more than 20% of the phenotypic variance. Two well-studied systems, cellular control of molybdenum level by the ion-transporter MOT1 and flowering-time regulation by the FRI-FLC expression network, and a novel association for Leaf serration are used to illustrate the contribution of major individual loci, expression pathways, and gene-by-environment interactions to the genetic variance heterogeneity.
Conflict of interest statement
The authors have declared that no competing interests exist.
Figures
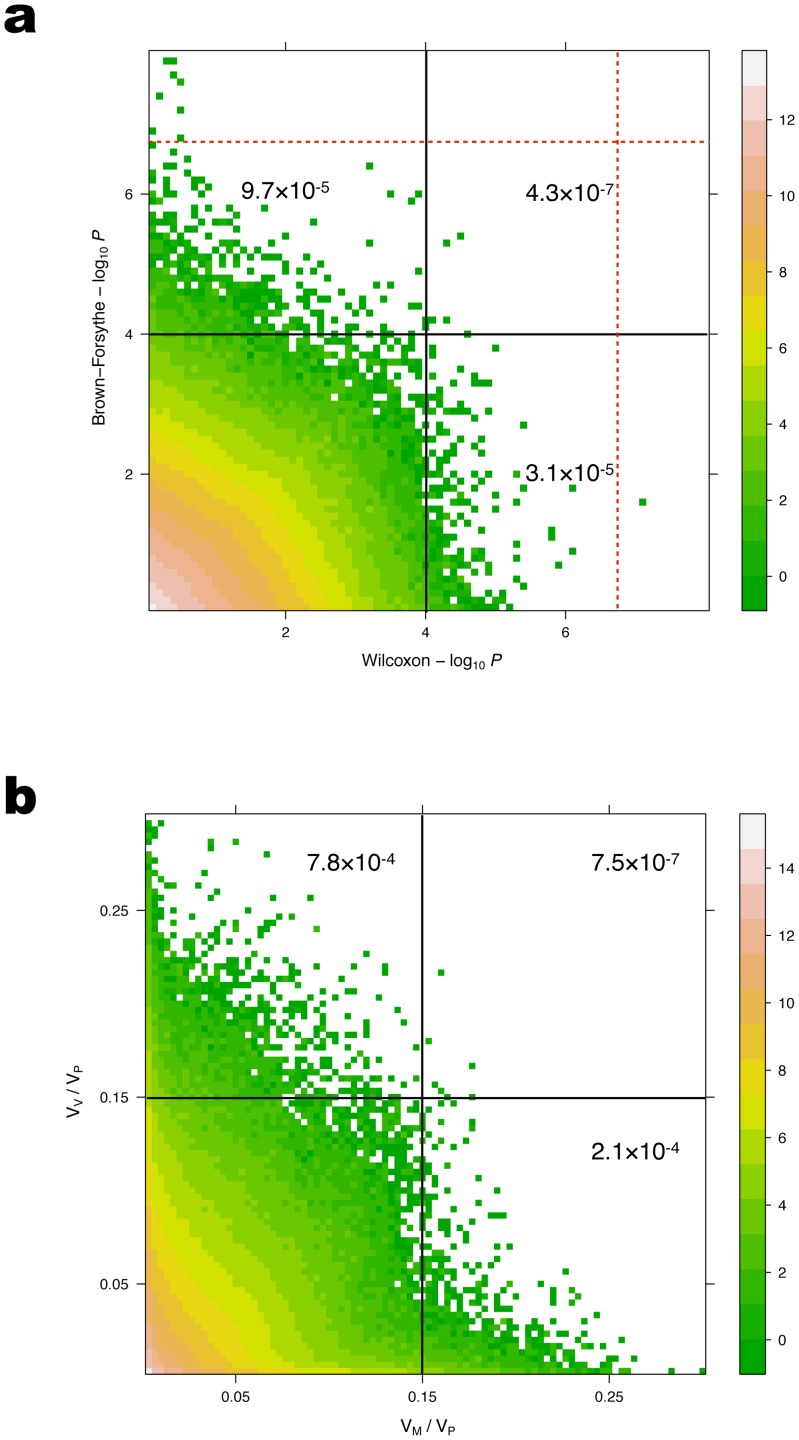
 for all the quantitative traits with
  -value inflation
  . The red dashed lines indicate the Bonferroni-corrected significance threshold. The scatterplots are heat maps for the logarithm of the number of dots in each mesh cell. A sub genome-wide significance threshold of
  is marked in (a), and a cutoff of 15% is marked in (b). The value in each block shows the ratio of the number of points in the block to the total number of points in the subfigure.
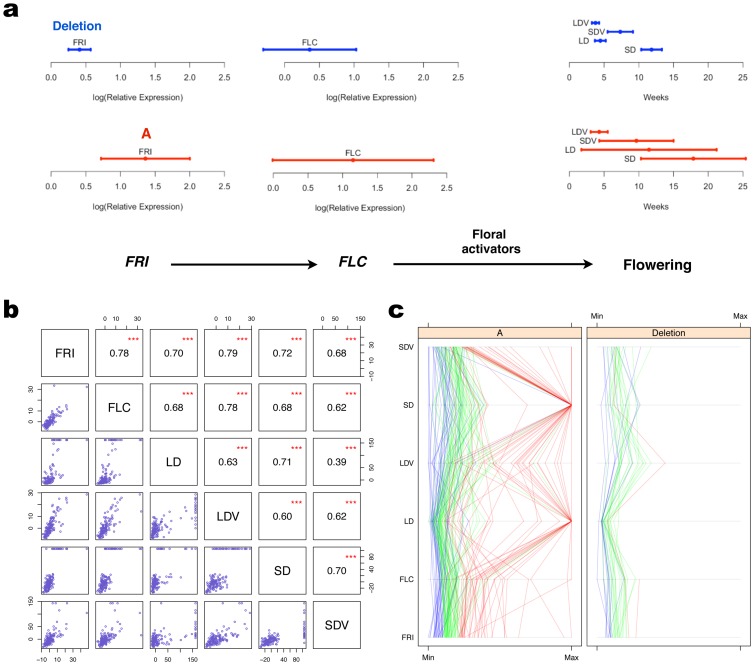
 -value less than
  . (c): For all the phenotypes in the pathway, the values for individuals are connected by lines. The color of the line for an individual is assigned based on its level of FRI expression. Individuals with FRI expression below the 25% quantile are in blue, between the 25% and 75% quantiles in green, and above the 75% quantile in red.
References
-
- Dworkin I (2005) Canalization, cryptic variation, and developmental buffering: A critical examination and analytical perspective. Review Literature And Arts Of The Americas Chapter 8 in: Variation 131–158.
-
- Hill WG, Mulder H (2010) Genetic analysis of environmental variation. Genetics Research, Cambridge 92: 381–395. - PubMed
-
- Kitano H (2004) Biological robustness. Nature Reviews Genetics 5: 826–837. - PubMed
-
- Rutherford S, Lindquist S (1998) Hsp90 as a capacitor for morphological evolution. Nature 396: 336–342. - PubMed
Publication types
MeSH terms
Substances
LinkOut - more resources
Full Text Sources
Molecular Biology Databases
