. 2012;7(8):e42173.
doi: 10.1371/journal.pone.0042173. Epub 2012 Aug 2.

Specialized motor-driven dusp1 expression in the song systems of multiple lineages of vocal learning birds

Affiliations

Specialized motor-driven dusp1 expression in the song systems of multiple lineages of vocal learning birds

Haruhito Horita et al. PLoS One. 2012.

Abstract

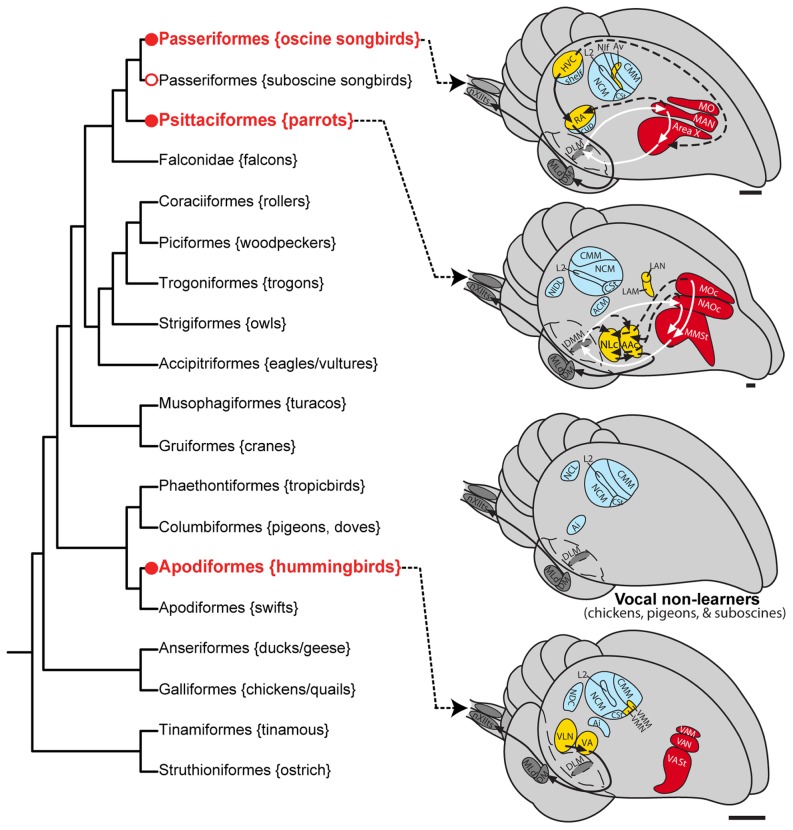
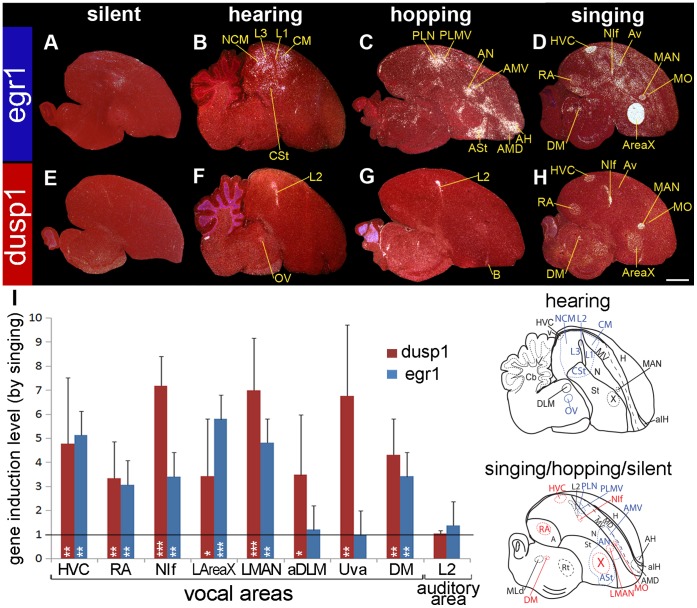
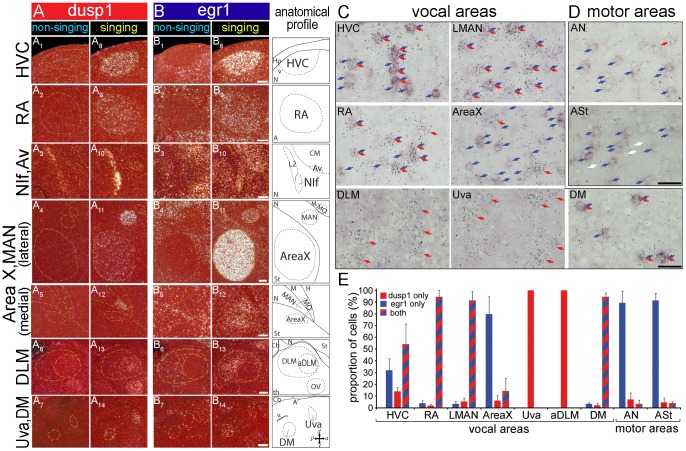
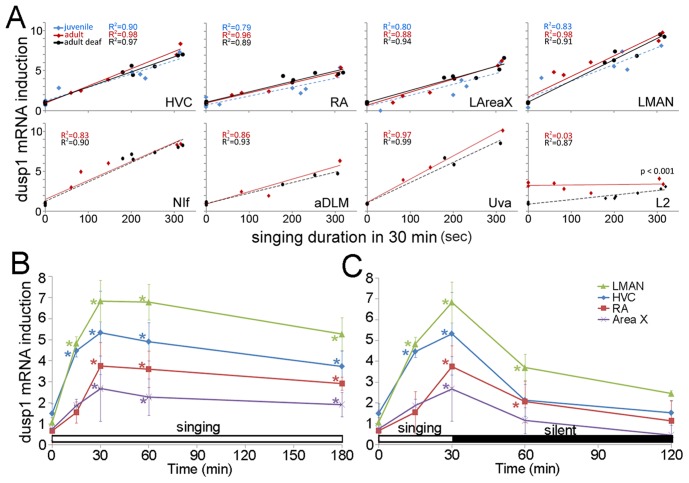
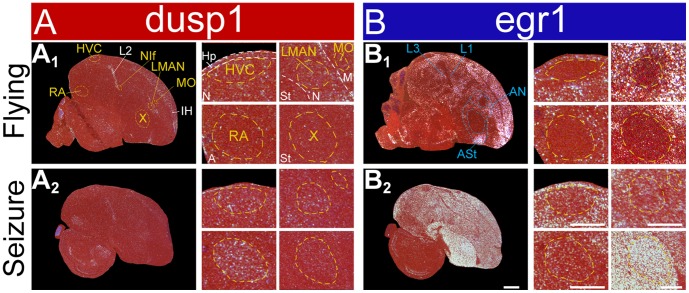
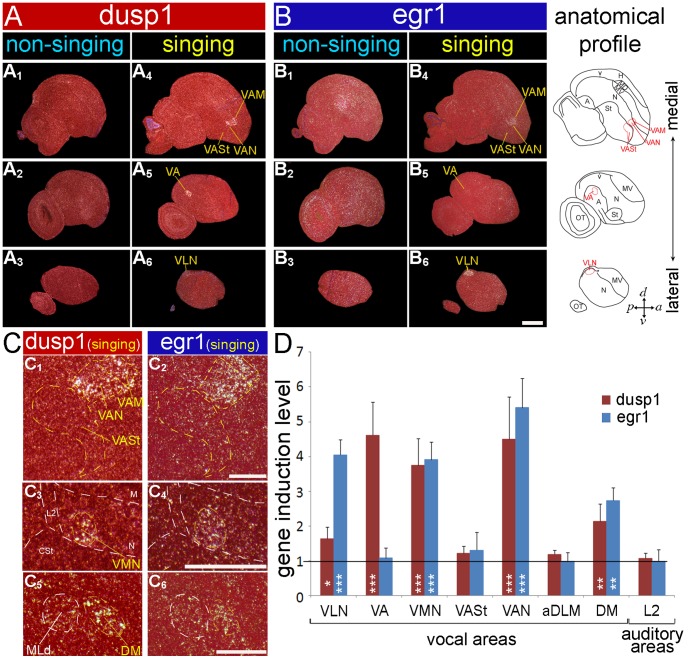
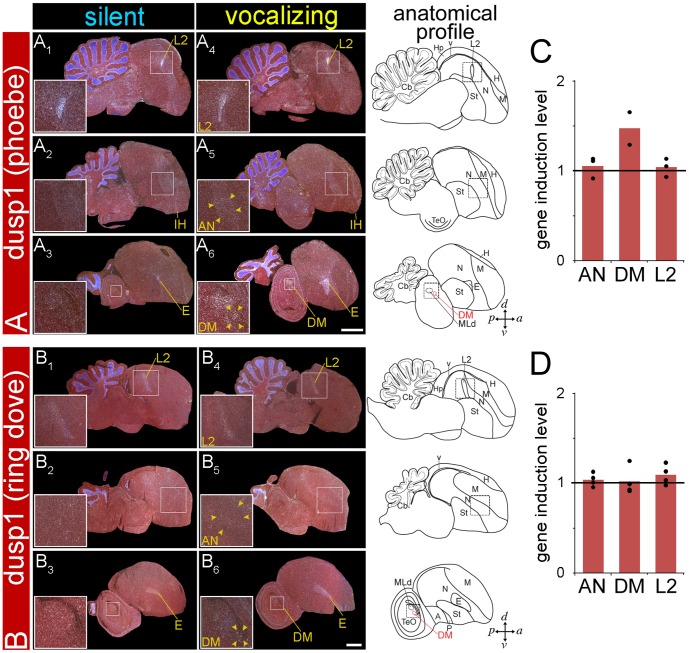
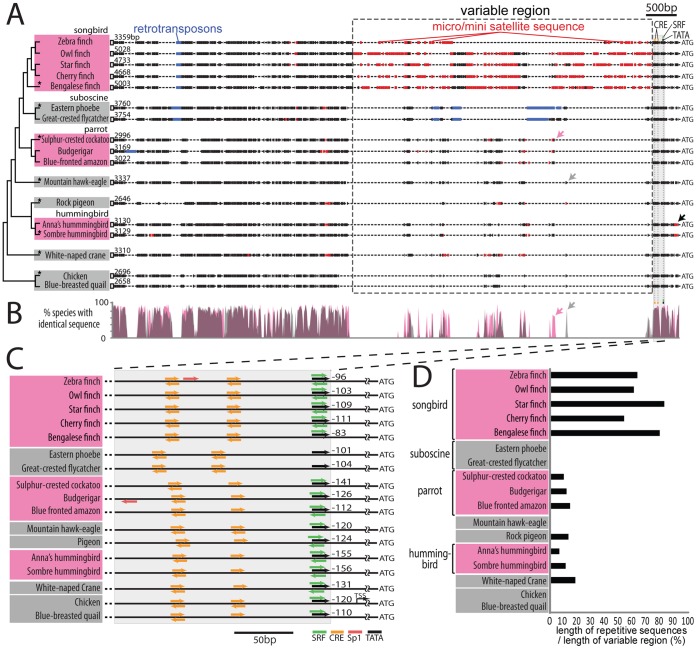
Mechanisms for the evolution of convergent behavioral traits are largely unknown. Vocal learning is one such trait that evolved multiple times and is necessary in humans for the acquisition of spoken language. Among birds, vocal learning is evolved in songbirds, parrots, and hummingbirds. Each time similar forebrain song nuclei specialized for vocal learning and production have evolved. This finding led to the hypothesis that the behavioral and neuroanatomical convergences for vocal learning could be associated with molecular convergence. We previously found that the neural activity-induced gene dual specificity phosphatase 1 (dusp1) was up-regulated in non-vocal circuits, specifically in sensory-input neurons of the thalamus and telencephalon; however, dusp1 was not up-regulated in higher order sensory neurons or motor circuits. Here we show that song motor nuclei are an exception to this pattern. The song nuclei of species from all known vocal learning avian lineages showed motor-driven up-regulation of dusp1 expression induced by singing. There was no detectable motor-driven dusp1 expression throughout the rest of the forebrain after non-vocal motor performance. This pattern contrasts with expression of the commonly studied activity-induced gene egr1, which shows motor-driven expression in song nuclei induced by singing, but also motor-driven expression in adjacent brain regions after non-vocal motor behaviors. In the vocal non-learning avian species, we found no detectable vocalizing-driven dusp1 expression in the forebrain. These findings suggest that independent evolutions of neural systems for vocal learning were accompanied by selection for specialized motor-driven expression of the dusp1 gene in those circuits. This specialized expression of dusp1 could potentially lead to differential regulation of dusp1-modulated molecular cascades in vocal learning circuits.


Conflict of interest statement

Competing Interests: The authors have declared that no competing interests exist.

Figures

Figure 1
Figure 1. Phylogenetic relationships and vocal pathways in avian vocal learners and vocal non-learners.
Left: Phylogeny of some of the major avian orders based on DNA sequences of 19 nuclear loci leads to our suggestion of two independent gains (hummingbirds and ancestor of parrots and oscine songbirds) and then a lost in suboscine songbirds. Also see for support of this view. Alternative phylogenies exist, all with vocal learners distantly related to each other , . This phylogenetic tree should be treated as a hypothesis as it is subject to change with more DNA sequences added. The Latin name of each order is given, along with examples of common species. Circles show the minimal ancestral nodes where vocal learning could have either evolved (red) or been lost (white) independently. Right: Proposed comparable vocal and auditory brain areas among vocal learning and vocal non-learning birds. Yellow regions and black arrows, posterior vocal pathways; red regions and white arrows, anterior vocal pathways; dashed lines, connections between the two vocal pathways; blue, auditory regions. For simplification, not all connections are shown. The thalamus has broken-line boundaries to indicate that it is covered by the telencephalon in this view. Not all species have been examined for the presence or absence of song nuclei. Neuroanatomical data of representative species are from the following publications , , , , . Scale bars ≈ 1 mm. Abbreviations: ACM, caudal medial arcopallium; NCL, caudal lateral nidopallium; NDC, caudal dorsal nidopallium; NIDL, dorsal lateral intermediate nidopallium. For other anatomical abbreviations, see Table 1.
Figure 2
Figure 2. Egr1 and dusp1 mRNA expression in zebra finch brain induced by hearing, hopping, and singing.
(A–D) Darkfield images of in situ hybridizations with egr1 from male zebra finches of four different behavioral conditions: (A) silent control sitting in the dark; (B) sitting and hearing song for 30 min in the dark; (C) deaf animals hopping in a rotating wheel in the dark; and (D) singing alone (>305.6 sec; >102 song bouts) and some hopping for 30 min in the light. (E–H) Adjacent sagittal sections hybridized to dusp1. All animals were in sound attenuation chambers. Three regions show overlap of hearing-driven and movement-driven gene expression: egr1 in PLN and PLMV, and dusp1 in the adjacent part of L2. See , for more details on hearing- and movement-driven gene expression results. Song nuclei are the only areas with overlap in induced high levels of egr1 and dusp1 expression. The anatomical drawings below the image show brain regions activated by hearing (medial brain section) or other conditions (lateral brain section), with vocal areas highlighted in red. White, gene expression, mRNA signal. Red, cresyl violet stain. Sections are sagittal. Scale bar  = 2 mm. (I) Quantification of dusp1 and egr1 expression. Values significantly above 1 indicate induced expression in singing animals (n  = 4, except for DLM and Uva n  = 3) relative to average of silent controls (n  = 3). Birds that sang >83.0 sec (>34 song bouts) in 30 min were used. The standard deviations of expression were large due to differences in singing amount (see Fig. 4A). Overall differences were significant (p<0.001, repeated measure ANOVA between singing and silent groups). * p<0.05, ** p<0.01, and *** p<0.001, unpaired t-test in each nucleus relative to silent control. Error bars, ±SD. The highest to lowest levels for dusp1 were in NIf, LMAN, Uva > HVC > DM, DLM, X, RA (p<0.01, ANOVA); For egr1 - AreaX > HVC > LMAN > NIf > RA > Uva, DLM (p<0.05, ANOVA). Abbreviations: A, Arcopallium; aIH, anterior part of the intercalated layer of the hyperpallium; H, hyperpallium; Hp, hippocampus; M, mesopallium; MD, dorsal mesopallium; MV, ventral mesopallium; N, nidopallium; Rt, nucleus rotundus; St, striatum; v, ventricle. For other anatomical abbreviations, see Table 1.
Figure 3
Figure 3. Magnified images of co-expressed dusp1 and egr1 mRNA in vocal areas and adjacent non-vocal areas.
(A) dusp1 mRNA expression in song nuclei in a non-singing (A1–7), and singing (A8–14) male that sang for 30 min. (B) egr1 mRNA expression in adjacent sections. Yellow dashed lines, Nissl-stained boundary of areas labeled in anatomical profiles in the right most column. Sections are sagittal; anterior is right, dorsal is up. Scale bars  = 200 µm. (C) Double-labeled images of vocal areas. Egr1 mRNA is labeled with DIG probe as a purple/brown precipitate and dusp1 mRNA is labeled with a S35-probe detected by silver grains. Colored arrows refer to single dusp1 (red), single egr1 (blue), and double labeled (red/blue) cells. (D) Double-labeled images of movement-activated areas adjacent to LMAN (AN) and LAreaX (ASt). White arrows refer to examples of chromogenic background signals with a shadow effect (lighter inside the nucleus), which we used to locate individual cells. Orientation: Dorsal is up and anterior to the right. Scale bars  = 20 µm. (E) Proportion of single and double labeled cells in each area. The relative distribution of double-labeled cells among vocal areas and motor areas are significantly different (p<0.05 and <0.001; AreaX vs ASt and LMAN vs AN, respectively; n  = 3 animals; ANOVA). The distribution of labeled categories in RA and LMAN are significantly different from Area X (p<0.05, ANOVA), where in the latter only large cells are dusp1-labeled and small cells are either egr1-labeled or double-labeled.
Figure 4
Figure 4. Temporal dynamics and auditory-feedback independence of singing-induced dusp1 expression.
(A) Expression of dusp1 mRNA in intact adult (n  = 5), deafened adult (n  = 6), and juvenile subsong (n  = 5) singers in seven song nuclei (HVC, RA, NIf, LMAN, LAreaX, aDLM and Uva) and an auditory area (L2). Values were normalized by the average value in the same area of silent control animals of each group (n  = 3 each). Due to their small size, fewer singing samples were located for Uva (n  = 3 each group) and aDLM (n  = 3 each group). Lines represent the best fit of the data analyzed by simple regression (R2 and p-values, upper left). Only L2 showed a difference in intact and deaf animals (p<value, lower right, multiple regression). (B) Time course of continuous singing-induced dusp1 expression in birds that sang for various times, normalized to the average of silent controls (0 min). (C) Time course of discontinuous acute singing, where singing was stopped at 30 min. There was an overall difference among time points (p<0.001 in B and p<0.001 in C, repeated measures ANOVA), *p<0.05, Dunnett’s post test of each singing time point relative to silent controls (0 min). Values are averages ±SD.
Figure 5
Figure 5. Lack of strong induction of dusp1 in areas adjacent to song nuclei.
(A) Representative images of dusp1 expression in two groups of birds: A1 flying, A2 metrazole-induced seizure. White, gene expression, mRNA signal; red, cresyl violet cellular stain. (B) Adjacent sections hybridized with egr1. Scale bars  = 1 mm for whole brains, and 500 µm for high power images of song nuclei.
Figure 6
Figure 6. Dusp1 and egr1 mRNA expression in budgerigar brain after singing.
(A) Darkfield images of in situ hybridization with dusp1 from a non-singing control (A1–4; no auditory stimulus, sitting relatively still) and a singing (A5–8) male bird that produced warble song for 30 mins. (B) Adjacent sections hybridized with egr1. Sagittal (A1,5, B1,5) and coronal (A2–4,6–8,B2–4,6–8) sections are shown. The right most column shows anatomical profiles with vocal areas highlighted in red; only the core of the MO and NAO song nuclei where we observe the dusp1 expression is drawn. (C) Magnified images of dusp1 and egr1 mRNA expression in the nuclei indicated after singing. (D) Quantification of dusp1 and egr1 expression. Values significantly above 1 indicate induced expression in singing animals (n  = 3) relative to the average of silent controls (n  = 3, overall difference p<0.001 repeated measures ANOVA; * p<0.05, ** p<0.01, and *** p<0.001 unpaired t-test for each brain region relative to silent controls). Error bars, ±SD. Scale bar  = 2 mm in B8 (applies to all A and B); 1 mm in C2 (applies to C1,2), C4 (applies to C3,4), and C6 (applies to C5,6).
Figure 7
Figure 7. Dusp1 and egr1 mRNA expression in sombre hummingbird brain after singing.
(A) Darkfield images of medial to lateral sagittal sections hybridized with dusp1 from a non-singing control (A1–3; no auditory stimulus, but flying) and a singing sombre hummingbird (A4–6) that sang for 30 min. (B) Adjacent sections hybridized with egr1. The level of egr1 induction in VA and VASt of the singing animal shown is low. White, gene expression, mRNA signal; red, cresyl violet stain. The right most column shows anatomical profiles with vocal areas highlighted in red. (C) Magnified images of dusp1 and egr1 mRNA expression in several song nuclei and in DM after singing. (D) Quantification of dusp1 and egr1 expression in vocal areas and in L2 after singing. Values significantly above 1 indicate induced expression in singing animals (n  = 3) relative to average of silent controls (n  = 3, overall difference p<0.001 repeated measures ANOVA; * p<0.05, ** p<0.01, and *** p<0.001 unpaired t-test for each brain region relative to silent controls). Error bars, ±SD. Egr1 and/or dusp1 induction in VA, VASt, aDLM was only expressed in animals that sang the most, and thus an overall significant difference is not seen when averaging across the animals used. Scale bar  = 1 mm in B6 (applies to all A and B); 500 µm in C2 (applies to C1,2), C4 (applies to C3,4), and C6 (applies to C5,6).
Figure 8
Figure 8. Dusp1 mRNA expression in the brains of vocal non-learners after singing.
Darkfield images of in situ hybridizations from medial to lateral sagittal series with dusp1 from Eastern phoebes (A) and ring doves (B). Shown are brain images from silent control male birds (A1–3, B1–3; no auditory stimulus) in a sound attenuation chamber and male birds that sang (phoebe) or cooed (ring dove) for 30 minutes (A4–6, B4–6). Inset shows areas highlighted in boxes and quantified: L2, AN, and DM. White, gene expression, mRNA signal. Red, cresyl violet stain. Lines and names in yellow, areas where each mRNA was robustly induced. Anatomical profiles to the right show vocal brain areas (DM) highlighted in red and non-vocal areas in black. Scale bars  = 2 mm. (C) Quantification of dusp1 expression in phoebes. (D) Quantification of dusp1 expression in ring doves. Values significantly above 1 indicate induced expression in vocalizing animals (n  = 3 for AN and L2; n  = 2 for DM of phoebes, n  = 4 for ring doves) relative to the average of silent controls (n  = 4 for phoebes, n  = 3 ring doves; un-paired t-test). No significant difference was found.
Figure 9
Figure 9. Upstream sequences of dusp1 among species.
(A) Schematic of the ∼3 kb upstream region of dusp1 in vocal learning and vocal non-learning avian species (range 2,646 to 5,048 bp depending on species). The conserved region used to clone the sequence among the avian species is indicated by an open box at the 5′ end. ATG is the initiation codon of the protein. Red boxes, repetitive microsatellite sequences. Blue boxes, retrotransposon sequences (MIR3/LINE-like and CR1/SINE-like elements in the songbirds, suboscines, and one parrot species). Arrows indicate the similar sequences found only in vocal learners (pink) or in vocal non-learners (grey). The black arrow indicates microsatellite sequence close to the start codon found in hummingbirds. Grey shaded region, proximal regulatory region where the putative cis-binding sites are found. (B) % of species with identical sequences among at least 2–3 vocal learners (pink) or 3 or more vocal non-learner lineages (grey). Overlap is pinkish-grey. (C) Region within 300 bp of the transcription start site (ATG), showing putative cis-binding sites for activity-dependent transcription factors (color-coded for individual transcription factors); direction of arrows indicates strand on which the binding motif was found (forward + strand; backward - strand). Translation start site (TSS) annotated in chicken genome. (D) Proportion of repetitive microsatellite sequence in the variable region between species (dashed boxed region in (A)).
Figure 10
Figure 10. Summary of gene induction in vocal and movement-activated areas of vocal learners.
Intensity of green indicates relative levels of activity-induced dusp1 or egr1 induction in each area, determined from the in situ hybridizations (see methods). White (0), no detectable induction; Dark Green (1), highest induction levels. Gene induction in song nuclei is due to singing, and in regions adjacent to song nuclei is due to moving. * The values for hummingbirds are an average of several species: sombre hummingbird (n  = 3 singing, n  = 3 silent), Anna’s hummingbird (n  = 2 singing, n  = 1 silent), and rufous-breasted hermit (n  = 2 singing, n  = 1 silent). For anatomical abbreviations, see Table 1.

Similar articles

Cited by

References

    1. Arendt J, Reznick D (2008) Convergence and parallelism reconsidered: what have we learned about the genetics of adaptation? Trends Ecol Evol 23: 26–32. - PubMed
    1. Mundy NI (2007) Coloration and the genetics of adaptation. PLoS Biol 5: e250. - PMC - PubMed
    1. Prud'homme B, Gompel N, Carroll SB (2007) Emerging principles of regulatory evolution. Proc Natl Acad Sci U S A 104 Suppl 1: 8605–8612. - PMC - PubMed
    1. Prud'homme B, Gompel N, Rokas A, Kassner VA, Williams TM, et al. (2006) Repeated morphological evolution through cis-regulatory changes in a pleiotropic gene. Nature 440: 1050–1053. - PubMed
    1. Shapiro MD, Bell MA, Kingsley DM (2006) Parallel genetic origins of pelvic reduction in vertebrates. Proc Natl Acad Sci U S A 103: 13753–13758. - PMC - PubMed

Publication types

Substances