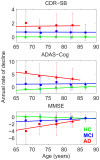
Rates of decline in Alzheimer disease decrease with age
- PMID: 22876315
- PMCID: PMC3410919
- DOI: 10.1371/journal.pone.0042325
Rates of decline in Alzheimer disease decrease with age
Abstract
Age is the strongest risk factor for sporadic Alzheimer disease (AD), yet the effects of age on rates of clinical decline and brain atrophy in AD have been largely unexplored. Here, we examined longitudinal rates of change as a function of baseline age for measures of clinical decline and structural MRI-based regional brain atrophy, in cohorts of AD, mild cognitive impairment (MCI), and cognitively healthy (HC) individuals aged 65 to 90 years (total n = 723). The effect of age was modeled using mixed effects linear regression. There was pronounced reduction in rates of clinical decline and atrophy with age for AD and MCI individuals, whereas HCs showed increased rates of clinical decline and atrophy with age. This resulted in convergence in rates of change for HCs and patients with advancing age for several measures. Baseline cerebrospinal fluid densities of AD-relevant proteins, Aβ(1-42), tau, and phospho-tau(181p) (ptau), showed a similar pattern of convergence with advanced age across cohorts, particularly for ptau. In contrast, baseline clinical measures did not differ by age, indicating uniformity of clinical severity at baseline. These results imply that the phenotypic expression of AD is relatively mild in individuals older than approximately 85 years, and this may affect the ability to distinguish AD from normal aging in the very old. Our findings show that inclusion of older individuals in clinical trials will substantially reduce the power to detect disease-modifying therapeutic effects, leading to dramatic increases in required clinical trial sample sizes with age of study sample.
Conflict of interest statement
Figures


References
-
- Hebert LE, Scherr PA, Beckett LA, Albert MS, Pilgrim DM, et al. (1995) Age-specific incidence of Alzheimer’s disease in a community population. JAMA : the journal of the American Medical Association 273: 1354–1359. - PubMed
-
- Kukull WA, Higdon R, Bowen JD, McCormick WC, Teri L, et al. (2002) Dementia and Alzheimer disease incidence: a prospective cohort study. Arch Neurol 59: 1737–1746. - PubMed
Publication types
MeSH terms
Grants and funding
- K01 AG030514/AG/NIA NIH HHS/United States
- R01 AG031224/AG/NIA NIH HHS/United States
- CAPMC/ CIHR/Canada
- P30 AG013846/AG/NIA NIH HHS/United States
- P50MH081755/MH/NIMH NIH HHS/United States
- P50 MH081755/MH/NIMH NIH HHS/United States
- P30 AG010129/AG/NIA NIH HHS/United States
- NIH-NIBIB T32 EB005970/EB/NIBIB NIH HHS/United States
- P50 NS022343/NS/NINDS NIH HHS/United States
- U01 AG024904/AG/NIA NIH HHS/United States
- U19 AG010483/AG/NIA NIH HHS/United States
- R01AG031224/AG/NIA NIH HHS/United States
- T32 EB005970/EB/NIBIB NIH HHS/United States
- U54 NS056883/NS/NINDS NIH HHS/United States
- U54NS056883/NS/NINDS NIH HHS/United States
- P30 AG019610/AG/NIA NIH HHS/United States
- R01AG22381/AG/NIA NIH HHS/United States
- P50NS22343/NS/NINDS NIH HHS/United States
- NIA K01AG029218/AG/NIA NIH HHS/United States
- K01 AG029218/AG/NIA NIH HHS/United States
- R01 AG022381/AG/NIA NIH HHS/United States

