. 2012 Aug 1;3(8):1924-32.
doi: 10.1364/BOE.3.001924. Epub 2012 Jul 24.

Nondestructive volumetric imaging of tissue microstructure with benchtop x-ray phase-contrast tomography and critical point drying

Nondestructive volumetric imaging of tissue microstructure with benchtop x-ray phase-contrast tomography and critical point drying

Adam M Zysk et al. Biomed Opt Express. .

Abstract

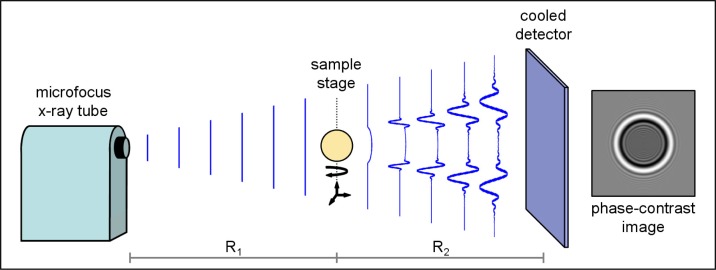
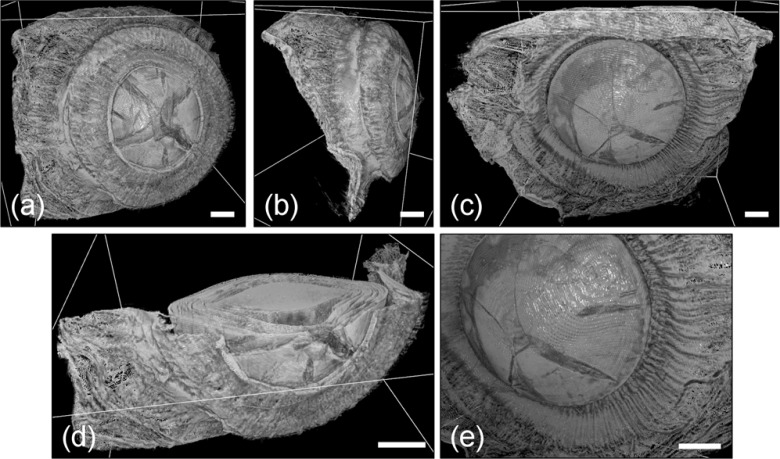
The in vitro investigation of many optically opaque biological microstructures requires 3D analysis at high resolution over a large field of view. We demonstrate a new nondestructive volumetric imaging technique that eliminates the structural and computational limitations of conventional 2D optical microscopy by combining x-ray phase-contrast tomography with critical point drying sample preparation. We experimentally demonstrate the enhancement of small features afforded by phase-contrast imaging and show the contrast improvement afforded by the drying of a hydrated specimen. We further demonstrate the biological application of this technique by imaging the microstructure of the accommodative apparatus in a primate eye using a benchtop phase-contrast tomography system.

Keywords: (110.7440) X-ray imaging; (170.3880) Medical and biological imaging; (170.4470) Ophthalmology; (170.6935) Tissue characterization; (170.6960) Tomography; (330.7322) Visual optics, accommodation; (350.5030) Phase.


Figures

Fig. 1
Fig. 1
In-line phase-contrast tomography system. The planar x-ray intensity is shown as it propagates from the microfocus source to the sample (distance R1) and from the sample to the detector (distance R2). Intensity fringes develop with propagation and are measured by a digital detector. An example simulated phase-contrast image of a sphere is shown on the right.
Fig. 2
Fig. 2
The contrast improvement induced by drying is shown here in projection images and plots of image histogram statistics. The cranial defect specimen, which was dried over a period of 58 minutes, shows fibrous polymer layer structures when dried (far right) that are relatively difficult to discern in the un-dried specimen (far left). Quantitative improvements in contrast are shown in the graphs of the time-dependent behavior of intensity histogram variance and uniformity. Note that the specimen occupies the entire frame in these images. The grayscale window is the same for all images.
Fig. 3
Fig. 3
The effect of propagation distance on phase contrast in projection images of a critical point dried baboon eye. In the low-propagation case (left), the fine structure of the crystalline lens and focusing structures are relatively indistinct. In the high-propagation case (right), in which phase-contrast is enhanced, these features are more easily visualized. Quantitative assessment of image statistics in two regions (boxes in the images) shows the effect of phase-enhancement on intensity histogram variance and uniformity. The grayscale window is the same for both images.
Fig. 4
Fig. 4
Transverse slices of the reconstructed tomography data of a critical point dried baboon eye. The proximal plane slice in (a) clearly shows the iris (i), ciliary structures (ci), and choroid (ch). The distal plane slice in (b) additionally shows the crystalline lens (cl). Note that although there is little absorption contrast visible in the interior of many structures, boundaries display significant edge contrast (e.g., the iris). A threshold was applied to the data for display purposes. The grayscale window is the same for both images.
Fig. 5
Fig. 5
A 3D volumetric rendering of the focusing apparatus of a critical point dried baboon eye. Anterior (a), lateral (b), and posterior (c) images show the large field of view that can be captured relative to microscopy. The transverse slice data exposed in the anterior view (d) demonstrate the simultaneous visualization of interior and exterior sample structures. Finally, the zoomed-in posterior view (e) shows the highly detailed visualization of ciliary structures emanating from the crystalline lens. A threshold was applied to the volumetric data for display purposes. Scale bars are 1 mm in length.

References

    1. Lütjen-Drecoll E., Tamm E., Kaufman P. L., “Age changes in rhesus monkey ciliary muscle: light and electron microscopy,” Exp. Eye Res. 47(6), 885–899 (1988).10.1016/0014-4835(88)90070-X - DOI - PubMed
    1. Kuszak J. R., Peterson K. L., Brown H. G., “Electron microscopic observations of the crystalline lens,” Microsc. Res. Tech. 33(6), 441–479 (1996).10.1002/(SICI)1097-0029(19960415)33:6<441::AID-JEMT1>3.0.CO;2-O - DOI - PubMed
    1. Lütjen-Drecoll E., Kaufman P. L., Wasielewski R., Ting-Li L., Croft M. A., “Morphology and accommodative function of the vitreous zonule in human and monkey eyes,” Invest. Ophthalmol. Vis. Sci. 51(3), 1554–1564 (2010).10.1167/iovs.09-4008 - DOI - PMC - PubMed
    1. Gardella D., Hatton W. J., Rind H. B., Rosen G. D., von Bartheld C. S., “Differential tissue shrinkage and compression in the z-axis: implications for optical disector counting in vibratome-, plastic- and cryosections,” J. Neurosci. Methods 124(1), 45–59 (2003).10.1016/S0165-0270(02)00363-1 - DOI - PubMed
    1. Jones A. S., Milthorpe B. K., Howlett C. R., “Measurement of microtomy-induced section distortion and its correction for 3-dimensional histological reconstructions,” Cytometry 15(2), 95–105 (1994).10.1002/cyto.990150203 - DOI - PubMed

LinkOut - more resources