Review
. 2012:199:337-358.
doi: 10.1016/B978-0-444-59427-3.00019-8.

The impact of the circadian timing system on cardiovascular and metabolic function

Affiliations
Review

The impact of the circadian timing system on cardiovascular and metabolic function

Christopher J Morris et al. Prog Brain Res. 2012.

Abstract

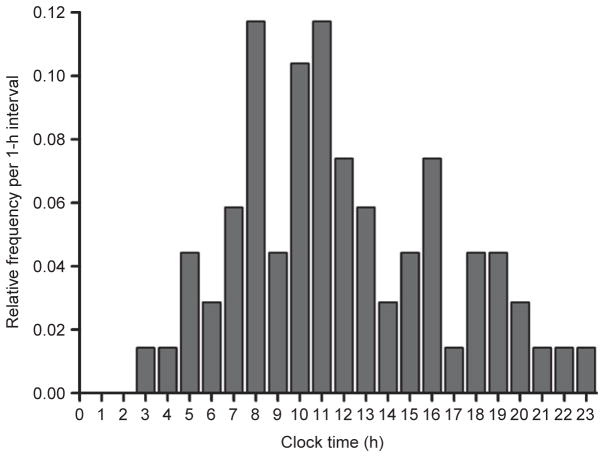
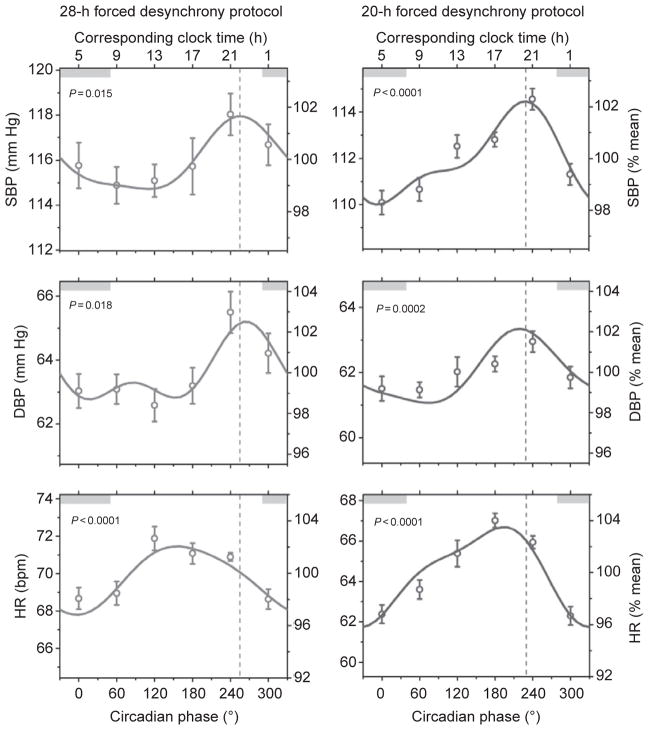
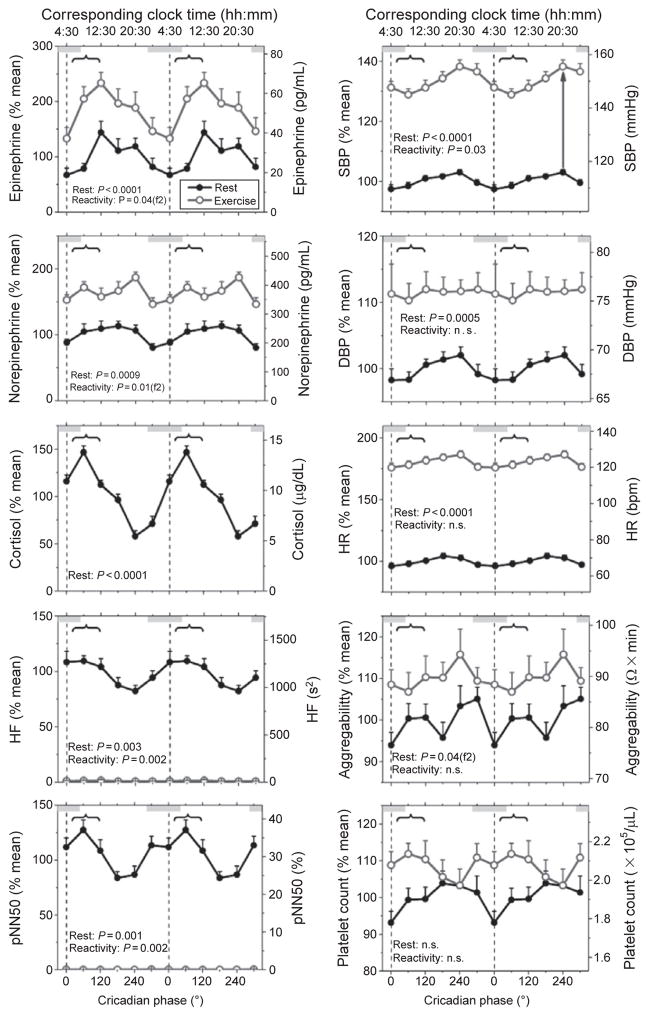
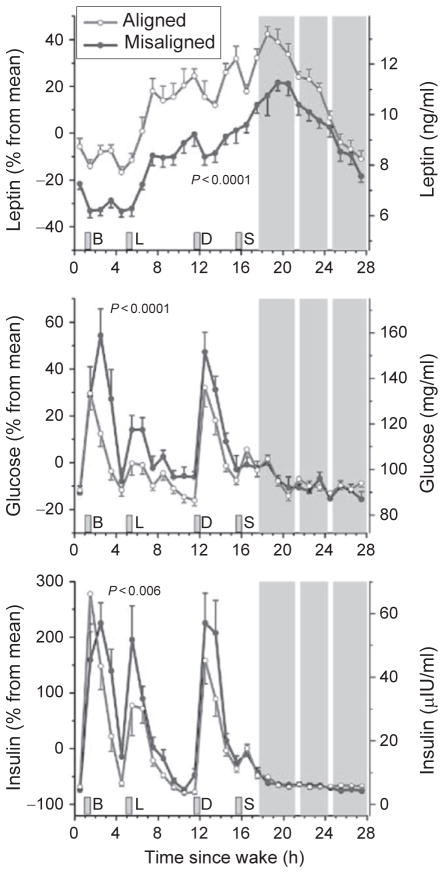
Epidemiological studies show that adverse cardiovascular events peak in the morning (i.e., between 6 AM and noon) and that shift work is associated with cardiovascular disease, obesity, and diabetes. The endogenous circadian timing system modulates certain cardiovascular risk markers to be highest (e.g., cortisol, nonlinear dynamic heart rate control, and platelet activation) or to respond most unfavorably to stressors such as exercise (e.g., epinephrine, norepinephrine, and vagal cardiac modulation) at an internal body time corresponding to the time of day when adverse cardiovascular events most likely occur. This indicates that the circadian timing system and its interaction with external cardiovascular stressors (e.g., physical activity) could contribute to the morning peak in adverse cardiovascular events. Moreover, circadian misalignment and simulated night work have adverse effects on cardiovascular and metabolic function. This suggests that misalignment between the behavioral cycle and the circadian timing system in shift workers contributes to that population's increased risk for cardiometabolic disease.


Figures

Fig. 1
Fig. 1
Relative frequency histogram for the time of onset of sustained ventricular tachycardia across the day. The figure illustrates a broad peak in the onset of sustained ventricular tachycardia between 8 and 11 AM. Redrawn and reproduced with permission from Twidale et al. (1989).
Fig. 2
Fig. 2
Circadian rhythm in resting systolic blood pressure (SBP), diastolic blood pressure (DBP), and heart rate (HR) observed in two (28- and 20-h) forced desynchrony protocols. Data are reported as mean±standard error of the mean and are expressed in absolute values (left axes) and as percentages of individual participant’s averages (right axes). Data are plotted according to circadian phase, that is, separated into six 60°-bins which all equate to ~4 h. Gray bars represent the participant’s average normal clock time for sleep under ambulatory conditions in the 2 weeks prior to admission to the laboratory. Solid lines represent the cosinor model fits. Dashed vertical lines indicate the circadian phase at which SBP peaked in both forced desynchrony protocols. Probability data indicate the likelihood of a circadian rhythm in blood pressure and heart rate. Reproduced with permission from Shea et al. (2011).
Fig. 3
Fig. 3
Influence of the endogenous circadian timing system on cardiovascular variables at rest and in response to standardized bicycle exercise. Participants undertook an 11-day (including 12 times 20-h “days”) forced desynchrony protocol in which they undertook 15 min of exercise (60% of maximum heart rate) at the same time into each wake period. Data are expressed relative to each participant’s resting value averaged across the whole forced desynchrony protocol (left axes) and in absolute values (right axes) and are plotted according to circadian phase that is separated into six 60°-bins that each equate to ~4 h. Black lines and closed circles indicate resting values, whereas gray lines with open circles represent data obtained during standardized exercise; error bars represent the standard error of the mean. Gray bars indicate the group average habitual clock time for sleep in the 2 weeks prior to admission to the laboratory. The vertical dotted line represents the timing of the group average core body temperature minimum and curly brackets signify the most vulnerable period for adverse cardiovascular events according to epidemiological research (6 AM to noon). Probability data were obtained via cosinor analysis. A statistically significant (P<0.05) second harmonic of a circadian rhythm is indicated by f2 appearing after the probability value. The arrow in the upper right plot is an example of the reactivity of systolic blood pressure to exercise at particular circadian phase. Reproduced with permission from Scheer et al. (2010).
Fig. 4
Fig. 4
The response of circulating levels of leptin, glucose, and insulin to circadian misalignment. Data are reported relative to each participant’s average values during circadian alignment on the left axes and in absolute values on the right axes. Error bars represent standard error of the mean. Gray area indicates the participant’s sleep opportunity. The white strips within the scheduled sleep opportunity represent when participants were briefly awoken to perform pulmonary function tests. B, breakfast; L, lunch; D, dinner; S, snack. Reproduced with permission from Scheer et al. (2009).

References

    1. Åkerstedt T. Shift work and disturbed sleep/wakefulness. Sleep Medicine Reviews. 1998;2:117–128. - PubMed
    1. Al-Naimi S, Hampton SM, Richard P, Tzung C, Morgan LM. Postprandial metabolic profiles following meals and snacks eaten during simulated night and day shift work. Chronobiology International. 2004;21:937–947. - PubMed
    1. Arble DM, Bass J, Laposky AD, Vitaterna MH, Turek FW. Circadian timing of food intake contributes to weight gain. Obesity. 2009;17:2100–2102. - PMC - PubMed
    1. Balsalobre A, Damiola F, Schibler U. A serum shock induces circadian gene expression in mammalian tissue culture cells. Cell. 1998;93:929–937. - PubMed
    1. Boivin DB, James FO. Circadian adaptation to night-shift work by judicious light and darkness exposure. Journal of Biological Rhythms. 2002;17:556–567. - PubMed

Publication types

MeSH terms