

Corrected end-tidal P(CO(2)) accurately estimates Pa(CO(2)) at rest and during exercise in morbidly obese adults
- PMID: 22878275
- PMCID: PMC3566997
- DOI: 10.1378/chest.12-0896
Corrected end-tidal P(CO(2)) accurately estimates Pa(CO(2)) at rest and during exercise in morbidly obese adults
Abstract
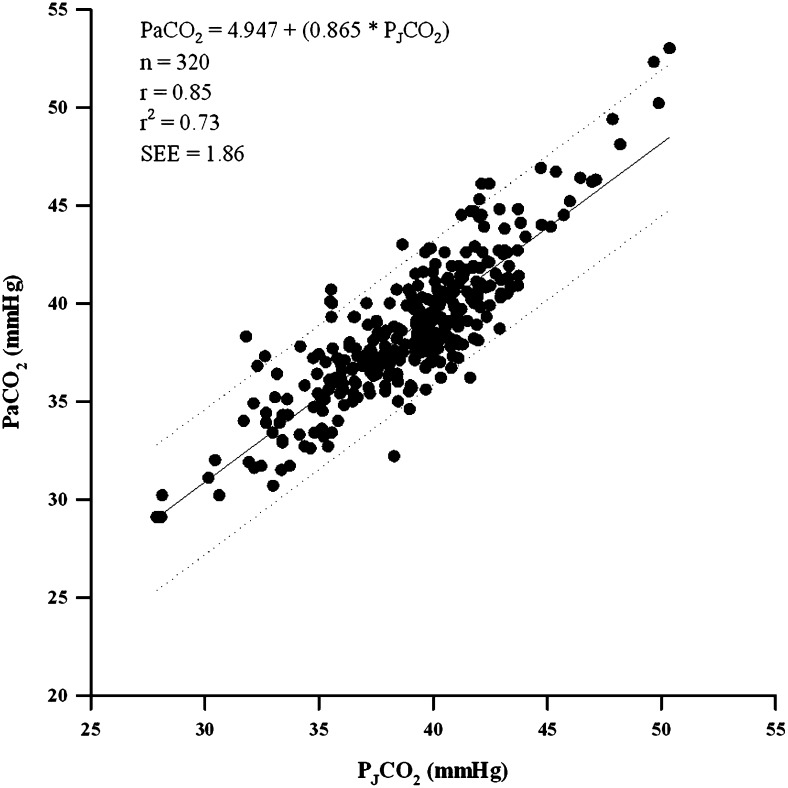
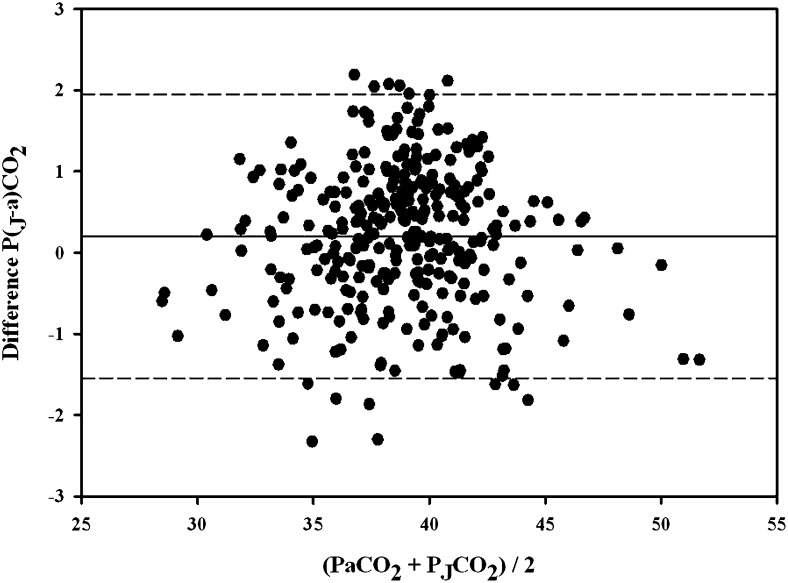
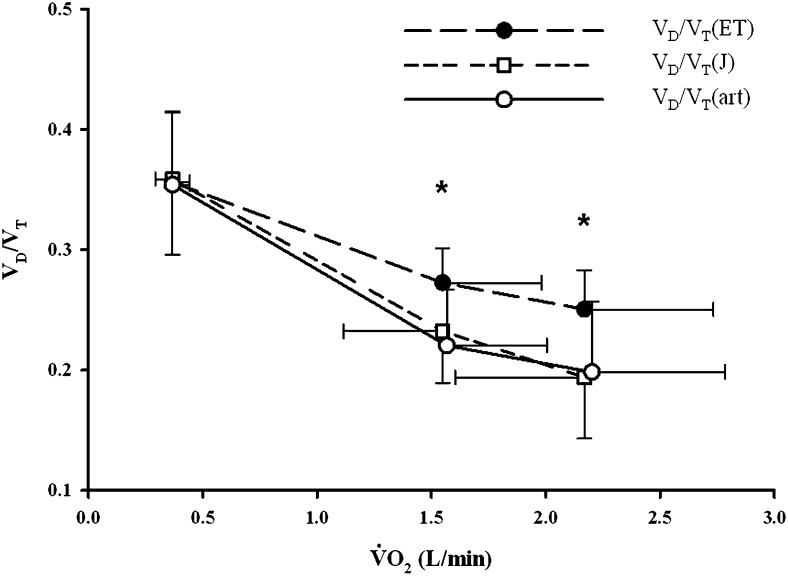
Background: Obesity affects lung function and gas exchange and imposes mechanical ventilatory limitations during exercise that could disrupt the predictability of Pa(CO(2)) from end-tidal P(CO(2)) (P(ETCO(2))), an important clinical tool for assessing gas exchange efficiency during exercise testing. Pa(CO(2)) has been estimated during exercise with good accuracy in normal-weight individuals by using a correction equation developed by Jones and colleagues (P(JCO(2)) = 5.5 + 0.9 x P(ETCO(2)) – 2.1 x tidal volume). The purpose of this project was to determine the accuracy of Pa(CO(2)) estimations from P(ETCO(2)) and P(JCO(2)) values at rest and at submaximal and peak exercise in morbidly obese adults.
Methods: Pa(CO(2)) and P(ETCO(2)) values from 37 obese adults (22 women, 15 men; age, 39 ± 9 y; BMI, 49 ± 7; [mean ± SD]) were evaluated. Subjects underwent ramped cardiopulmonary exercise testing to volitional exhaustion. P(ETCO(2)) was determined from expired gases simultaneously with temperature-corrected arterial blood gases (radial arterial catheter) at rest, every minute during exercise, and at peak exercise. Data were analyzed using paired t tests.
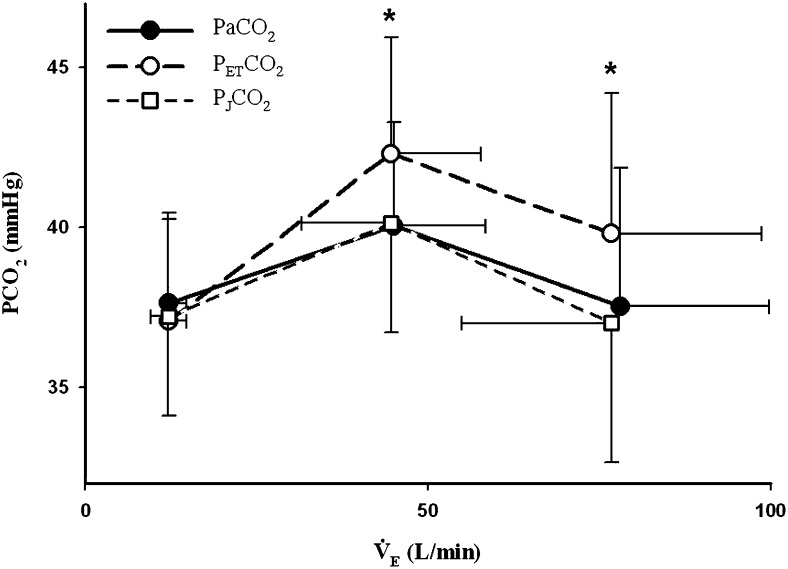
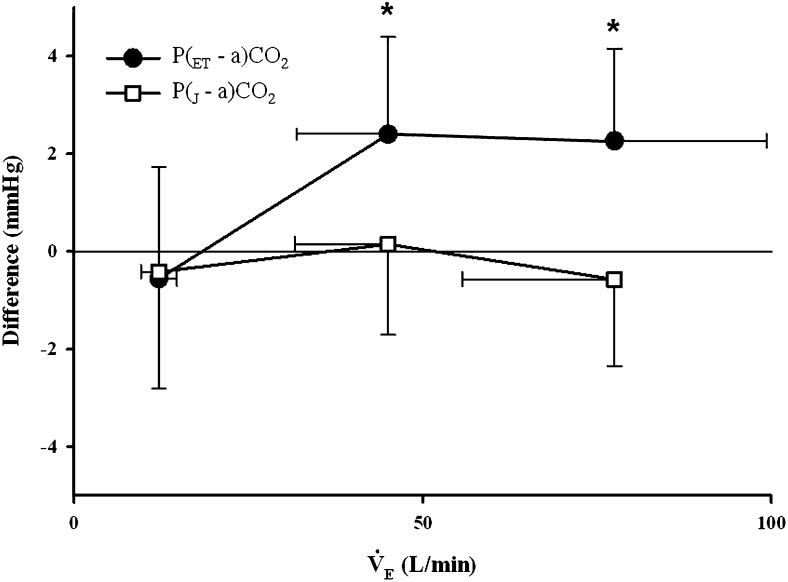
Results: P(ETCO(2)) was not significantly different from Pa(CO(2)) at rest (P(ETCO(2)) = 37 ± 3 mm Hg vs Pa(CO(2)) = 38 ± 3 mm Hg, P = .14). However, during exercise, P(ETCO(2)) was significantly higher than Pa(CO(2)) (submaximal: 42 ± 4 vs 40 ± 3, P < .001; peak: 40 ± 4 vs 37 ± 4, P < .001, respectively). Jones’ equation successfully corrected P(ETCO(2)), such that P(JCO(2)) was not significantly different from Pa(CO(2)) (submax: P(JCO(2)) = 40 ± 3, P = .650; peak: 37 ± 4, P = .065).
Conclusion: P(JCO(2)) provides a better estimate of Pa(CO(2)) than P(ETCO(2)) during submaximal exercise and at peak exercise, whereas at rest both yield reasonable estimates in morbidly obese individuals. Clinicians and physiologists can obtain accurate estimations of Pa(CO(2)) in morbidly obese individuals by using P(JCO(2)).
Figures
Similar articles
-
Preoperative gender differences in pulmonary gas exchange in morbidly obese subjects.Obes Surg. 2008 Dec;18(12):1587-98. doi: 10.1007/s11695-008-9527-6. Epub 2008 May 9. Obes Surg. 2008. PMID: 18465177
-
Poor compensatory hyperventilation in morbidly obese women at peak exercise.Respir Physiol Neurobiol. 2007 Nov 15;159(2):187-95. doi: 10.1016/j.resp.2007.07.001. Epub 2007 Jul 22. Respir Physiol Neurobiol. 2007. PMID: 17822966
-
Pulmonary gas exchange in the morbidly obese.Obes Rev. 2008 Jul;9(4):326-39. doi: 10.1111/j.1467-789X.2008.00471.x. Epub 2008 Mar 4. Obes Rev. 2008. PMID: 18331421 Review.
-
Dynamic physiological responses in obese and non-obese adults submitted to cardiopulmonary exercise test.PLoS One. 2021 Aug 9;16(8):e0255724. doi: 10.1371/journal.pone.0255724. eCollection 2021. PLoS One. 2021. PMID: 34370766 Free PMC article.
-
Measuring the efficiency of pulmonary gas exchange using expired gas instead of arterial blood: comparing the "ideal" Po2 of Riley with end-tidal Po2.Am J Physiol Lung Cell Mol Physiol. 2020 Aug 1;319(2):L289-L293. doi: 10.1152/ajplung.00150.2020. Epub 2020 Jun 3. Am J Physiol Lung Cell Mol Physiol. 2020. PMID: 32491950 Review.
Cited by
-
Sex differences in the ventilatory responses to exercise in mild to moderate obesity.Exp Physiol. 2022 Aug;107(8):965-977. doi: 10.1113/EP090309. Epub 2022 Jul 17. Exp Physiol. 2022. PMID: 35771362 Free PMC article.
-
Reply to: "Ventilatory efficiency in athletes, asthma and obesity": different ventilatory phenotypes during exercise in obesity?Eur Respir Rev. 2022 Jun 28;31(164):220054. doi: 10.1183/16000617.0054-2022. Print 2022 Jun 30. Eur Respir Rev. 2022. PMID: 35768131 Free PMC article.
-
Ventilatory efficiency in athletes, asthma and obesity.Eur Respir Rev. 2021 Jul 20;30(161):200206. doi: 10.1183/16000617.0206-2020. Print 2021 Sep 30. Eur Respir Rev. 2021. PMID: 34289980 Free PMC article. Review.
-
Obesity: challenges to ventilatory control during exercise--a brief review.Respir Physiol Neurobiol. 2013 Nov 1;189(2):364-70. doi: 10.1016/j.resp.2013.05.019. Epub 2013 May 21. Respir Physiol Neurobiol. 2013. PMID: 23707540 Free PMC article. Review.
-
Aspects of Exercise before or after Bariatric Surgery: A Systematic Review.Obes Facts. 2015;8(2):132-46. doi: 10.1159/000381201. Obes Facts. 2015. PMID: 25895670 Free PMC article.
References
-
- Wasserman K, Van Kessel AL, Burton GG. Interaction of physiological mechanisms during exercise. J Appl Physiol. 1967;22(1):71-85 - PubMed
-
- Whipp BJ, Wasserman K. Alveolar-arterial gas tension differences during graded exercise. J Appl Physiol. 1969;27(3):361-365 - PubMed
-
- Jones NL, Robertson DG, Kane JW. Difference between end-tidal and arterial PCO2 in exercise. J Appl Physiol. 1979;47(5):954-960 - PubMed
-
- Robbins PA, Conway J, Cunningham DA, Khamnei S, Paterson DJ. A comparison of indirect methods for continuous estimation of arterial PCO2 in men. J Appl Physiol. 1990;68(4):1727-1731 - PubMed
-
- Dubois AB, Britt AG, Fenn WO. Alveolar CO2 during the respiratory cycle. J Appl Physiol. 1952;4(7):535-548 - PubMed
Publication types
MeSH terms
Substances
Grants and funding
LinkOut - more resources
Full Text Sources
Other Literature Sources
Medical
