. 2012 Sep 21;337(6101):1541-6.
doi: 10.1126/science.1221711. Epub 2012 Aug 9.

Loss of the tumor suppressor BAP1 causes myeloid transformation

Affiliations

Loss of the tumor suppressor BAP1 causes myeloid transformation

Anwesha Dey et al. Science. .

Abstract

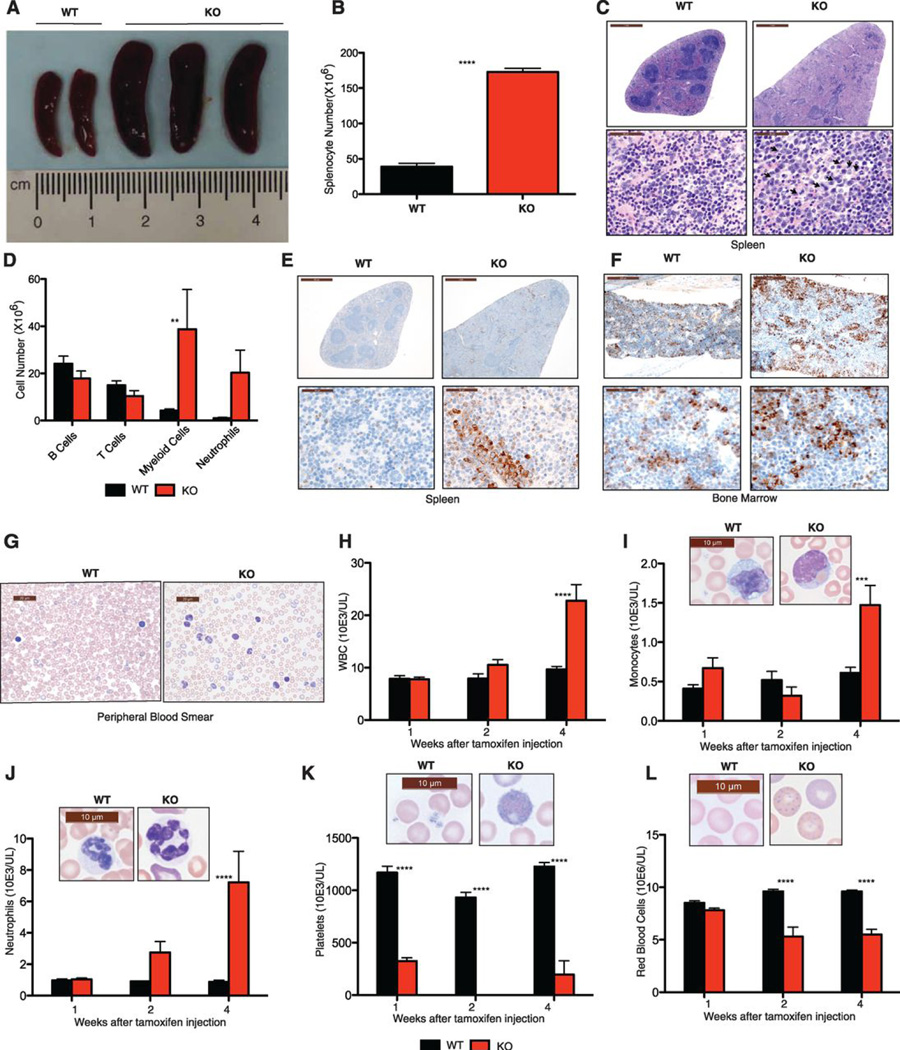
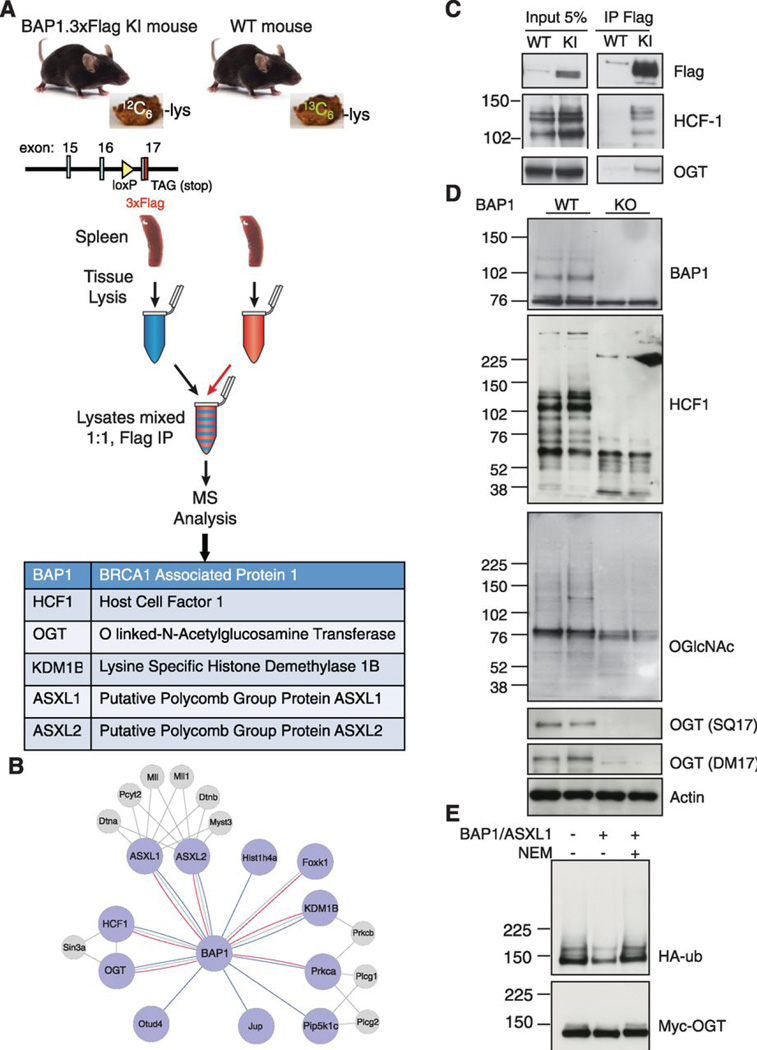
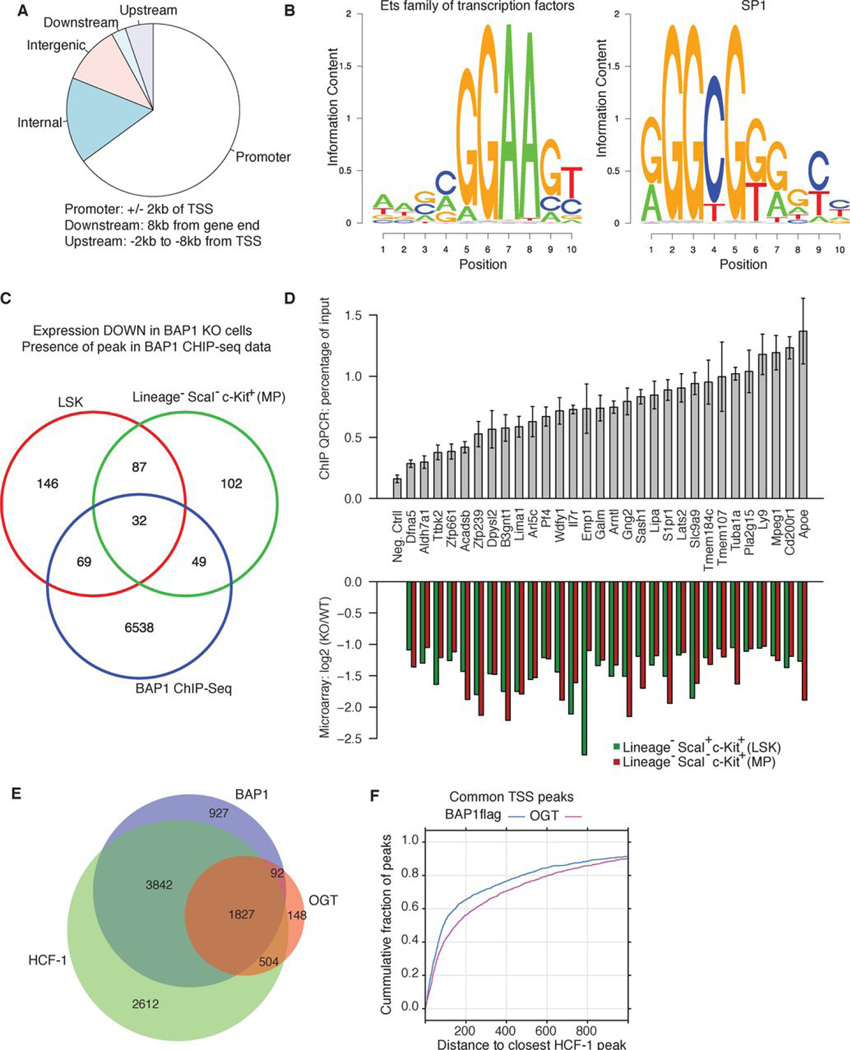
De-ubiquitinating enzyme BAP1 is mutated in a hereditary cancer syndrome with increased risk of mesothelioma and uveal melanoma. Somatic BAP1 mutations occur in various malignancies. We show that mouse Bap1 gene deletion is lethal during embryogenesis, but systemic or hematopoietic-restricted deletion in adults recapitulates features of human myelodysplastic syndrome (MDS). Knockin mice expressing BAP1 with a 3xFlag tag revealed that BAP1 interacts with host cell factor-1 (HCF-1), O-linked N-acetylglucosamine transferase (OGT), and the polycomb group proteins ASXL1 and ASXL2 in vivo. OGT and HCF-1 levels were decreased by Bap1 deletion, indicating a critical role for BAP1 in stabilizing these epigenetic regulators. Human ASXL1 is mutated frequently in chronic myelomonocytic leukemia (CMML) so an ASXL/BAP1 complex may suppress CMML. A BAP1 catalytic mutation found in a MDS patient implies that BAP1 loss of function has similar consequences in mice and humans.


Figures

Fig. 1
Fig. 1
BAP1 deficiency results in MDS/CMML-like disease. (A) Bap1+/+ creERT2+ (WT) and Bap1fl/fl creERT2+ (KO) spleens at 4 weeks after tamoxifen treatment. (B) Total splenocytes at 4 weeks. (C) Haematoxylin and eosin staining of spleens at 4 weeks. (D) Leukocyte subsets in spleen at 4 weeks by flow cytometry. Identifying surface markers were B220 (B cells), CD3ε (T cells), CD11b (myeloid cells), and CD11b plus Gr1 (neutrophils). (E–F) Myeloperoxidase staining of spleen (E) and bone marrow (F) at 4 weeks. (G) Peripheral blood smears at 4 weeks. (H–L) Peripheral blood cell counts. All graphs show the mean ± standard deviation for 5 mice of each genotype. Asterisks indicate statistically significant differences between WT and KO mice based on two-way ANOVA analysis, followed by Bonferroni post-test analysis. * P<0.05, *** P<0.001, **** P<0.0001.
Fig. 2
Fig. 2
BAP1 deficiency in hematopoietic cells is sufficient for MDS/CMML-like disease. (A) Bone marrow cells from CD45.2+ Bap1+/+ creERT2+ or Bap1fl/fl creERT2+ mice were transplanted into CD45.1+ lethally irradiated wild-type recipients. Tamoxifen was given to recipients at 5 weeks after transplantation to induce Bap1 deletion. (B–F) Peripheral blood cell counts (B–E) and hemoglobin levels (F) of reconstituted mice. (G) Splenic subsets at 4 weeks after tamoxifen treatment. Identifying surface markers were B220 (B cells), CD3ε (T cells), and CD11b (myeloid cells). (H) Flow cytometric analysis of lineage-negative bone marrow cell populations at 4 weeks after tamoxifen treatment. (I–J) Absolute numbers of lineage ScaI c-Kit+ myeloid progenitors (I) and lineage ScaI+ c-Kit+ (LSK) cells (J) in bone marrow at 4 weeks after tamoxifen treatment. All graphs show the mean ± standard deviation for 3–5 mice of each genotype. Asterisks indicate statistically significant differences between WT and KO mice based on two-way ANOVA analysis, followed by Bonferroni post-test analysis. * P<0.05, *** P<0.001, **** P<0.0001.
Fig. 3
Fig. 3
Identification and characterization of BAP1-associated proteins in mouse brain and spleen. (A) BAP1.3xFlag knock-in (KI) mice fed regular chow and wild-type (WT) mice fed "heavy" 13C6-lysine in their chow were used to make tissue lysates for anti-Flag immunoprecipitation (IP) and mass spectrometry (MS). Top IP hits that were represented by multiple unique peptides deriving primarily from the "light" BAP1.3xFlag KI are listed. (B) The mouse BAP1 interactome. Large nodes represent BAP1-interacting proteins identified in brain (blue lines) or spleen (red lines). Gray lines indicate known interactions from the STRING database. Smaller gray nodes represent proteins from the STRING database that are connected to two or more proteins from our dataset and include manually crated annotations. (C) Anti-Flag immunoprecipitations (IP) from WT and BAP1.3xFlag splenocytes. (D) Western blot analysis of WT and BAP1 KO splenocytes at 3 weeks after tamoxifen treatment. (E) Myc-tagged OGT was affinity purified from HEK293T cells co-transfected with HA-tagged ubiquitin and then incubated with BAP1/ASXL1 purified from Sf9 cells. Where indicated, BAP1 protease activity was inactivated with N-ethylmaleimide (NEM) prior to adding OGT.
Fig. 4
Fig. 4
Identification of BAP1-regulated genes. (A) Characterization of BAP1 binding sites identified by anti-Flag ChIP-seq analysis of BAP1.3xFlag BMDMs. (B) De novo motif enrichment analysis of BAP1 binding sites identified similarities to Ets (CGGAAG) and SP1 (GGGCGGGG) transcription factor binding sites. (C) Venn diagram of genes with BAP1 recruited to their promoter in BAP1.3xFlag BMDMs (blue circle), and genes with reduced expression in BAP1 KO lineage ScaI c-Kit+ myeloid progenitors (MP; green circle) or BAP1 KO LSK cells (red circle). (D) Putative BAP1 target genes identified in (C) were validated by ChIP-qPCR on BAP1.3xFlag BMDMs (top panel). Negative control (Neg. Ctrl) primers amplify a region in a gene desert and therefore binding of transcription factors is not expected. Bars show the mean ± standard deviation of triplicate wells, the chromatin deriving from BMDMs pooled from multiple KI mice. The lower panel shows microarray expression data for these genes in WT versus BAP1 KO MP or LSK cells. (E) Venn diagram showing the overlap between promoters occupied by BAP1.3xFlag, HCF-1, or OGT based on ChIP-seq analyses. (F) Distances separating BAP1 peaks and OGT peaks from HCF-1 peaks by ChIP-seq.

Comment in

References

    1. Harbour JW, et al. Frequent mutation of BAP1 in metastasizing uveal melanomas. Science. 2010;330:1410. - PMC - PubMed
    1. Jensen DE, et al. BAP1: a novel ubiquitin hydrolase which binds to the BRCA1 RING finger and enhances BRCA1-mediated cell growth suppression. Oncogene. 1998;16:1097. - PubMed
    1. Jensen DE, Rauscher FJ., 3rd Defining biochemical functions for the BRCA1 tumor suppressor protein: analysis of the BRCA1 binding protein BAP1. Cancer Lett. 1999;(143 Suppl 1):S13. - PubMed
    1. Guo G, et al. Frequent mutations of genes encoding ubiquitin-mediated proteolysis pathway components in clear cell renal cell carcinoma. Nat Genet. 2011;44:17. - PubMed
    1. Abdel-Rahman MH, et al. Germline BAP1 mutation predisposes to uveal melanoma, lung adenocarcinoma, meningioma, and other cancers. J Med Genet. 2011;48:856. - PMC - PubMed

MeSH terms