. 2012 Aug 16;488(7411):379-83.
doi: 10.1038/nature11312.

Activation of specific interneurons improves V1 feature selectivity and visual perception

Affiliations

Activation of specific interneurons improves V1 feature selectivity and visual perception

Seung-Hee Lee et al. Nature. .

Abstract

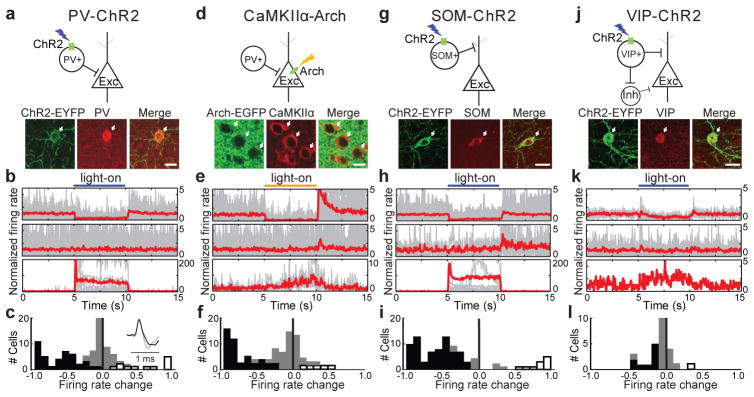
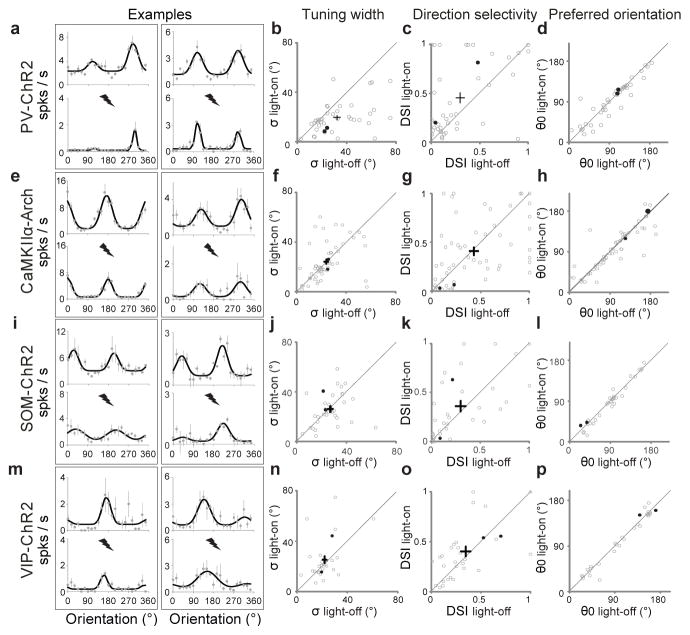
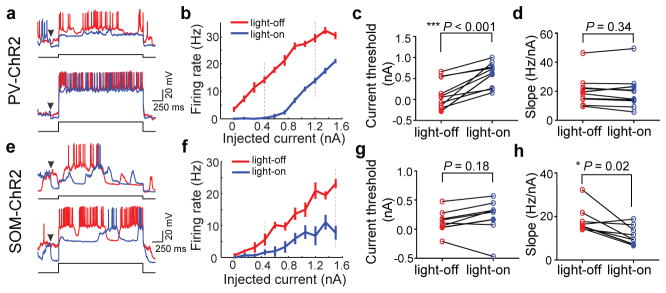
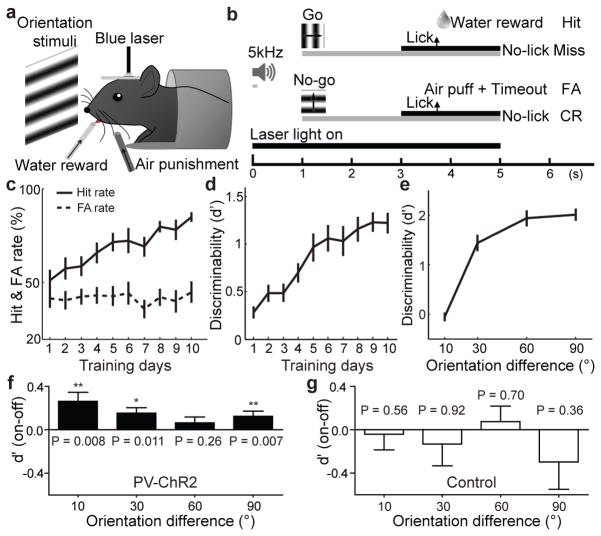
Inhibitory interneurons are essential components of the neural circuits underlying various brain functions. In the neocortex, a large diversity of GABA (γ-aminobutyric acid) interneurons has been identified on the basis of their morphology, molecular markers, biophysical properties and innervation pattern. However, how the activity of each subtype of interneurons contributes to sensory processing remains unclear. Here we show that optogenetic activation of parvalbumin-positive (PV+) interneurons in the mouse primary visual cortex (V1) sharpens neuronal feature selectivity and improves perceptual discrimination. Using multichannel recording with silicon probes and channelrhodopsin-2 (ChR2)-mediated optical activation, we found that increased spiking of PV+ interneurons markedly sharpened orientation tuning and enhanced direction selectivity of nearby neurons. These effects were caused by the activation of inhibitory neurons rather than a decreased spiking of excitatory neurons, as archaerhodopsin-3 (Arch)-mediated optical silencing of calcium/calmodulin-dependent protein kinase IIα (CAMKIIα)-positive excitatory neurons caused no significant change in V1 stimulus selectivity. Moreover, the improved selectivity specifically required PV+ neuron activation, as activating somatostatin or vasointestinal peptide interneurons had no significant effect. Notably, PV+ neuron activation in awake mice caused a significant improvement in their orientation discrimination, mirroring the sharpened V1 orientation tuning. Together, these results provide the first demonstration that visual coding and perception can be improved by increased spiking of a specific subtype of cortical inhibitory interneurons.


Figures

Figure 1
Figure 1. Optogenetic activation of PV+, SOM+, and VIP+ neurons and silencing of CaMKIIα+ neurons
a, Fluorescence images of immunostained PV+ cells (red) expressing ChR2 EYFP (green). Scale, 20 μm. Top, schematic illustration of experiment in a–c. b, PSTHs of neurons during 30 repeats of blue laser stimulation. Top, cells showing significant firing rate decrease (P<0.01, bootstrap; n=41). Middle, cells without significant change (n=43). Bottom, cells with significant increase (n=12). Gray, individual cells; red, average within each group. Blue bar, duration of laser stimulation (5 s). Firing rate of each cell was normalized by its mean rate over the 5 s before stimulation. c, Histogram of firing rate changes. Black, gray, white bars represent cells showing significant decreases (P<0.01), no change, and significant increases, respectively. Inset, spike waveform averaged across cells with significantly decreased (black) or increased (gray) firing; d–f, Similar to a–c, for Arch-mediated silencing of CaMKIIα+ neurons; g–i, for ChR2-mediated activation of SOM+ neurons; j–l, for ChR2-mediated activation of VIP+ neurons.
Figure 2
Figure 2. PV+ activation enhances V1 stimulus selectivity
a, Tuning curves of two cells, each box for one cell. Gray dots, measured firing rates (mean ± s.e.m.). Black line, fitted curve. Upper, no laser; lower, laser stimulation (thunderbolt mark). b–d, Population summary of ChR2-mediated changes in stimulus selectivity (n=41). Each circle represents one cell; cross, population average (±s.e.m.). b, Tuning width σ, light-off, 32.1±2.9° (s.e.m.), light-on, 19.7±1.9°; 22% individual neurons showed significant decrease at P<0.01 (bootstrap), none showed significant increase. c, DSI, light-off, 0.30±0.05, light-on, 0.45±0.06; 11% neurons showed significant increase, none showed significant decrease. d, Preferred orientation θ0, median difference between light-on and light-off, 6.2°. For neurons in b–d, laser reduced visually evoked firing rate from 5.5±0.6 (s.e.m.) to 2.8±0.5 spikes/s (P<10−4, paired t-test). Filled circles, examples cells in a. e–h, Similar to a–d, for CaMKIIα+ silencing. Mean firing rate reduced from 3.0±0.4 to 2.2±0.4 spikes/s (n=56, P=0.003). f, σ, light-off, 23.6±1.8°, light-on, 24.3±2.0°, no individual cell showed significant change. g, DSI, light-off,0.43±0.04, light-on, 0.41±0.04. h, θ0; median difference, 5.4°. i–l, Similar to a–d, for SOM-ChR2 mice. Firing rate reduced from 3.4±0.6 to 1.9±0.4 spikes/s (P<10−3). j, σ; light-off, 26.9±2.1°, light-on, 26.2±2.3°, n=33. No individual cell showed significant change. k, DSI; light-off, 0.29±0.05, light-on, 0.36±0.06. l, θ; median difference, 5.7°. m–p, for VIP-ChR2 mice (n=31). n, σ; light-off, 21.8±1.8°, light-on, 25.5±2.8°. o, DSI; light-off, 0.35±0.05, light-on, 0.41±0.05. p, θ0; median difference, 5.6°.
Figure 3
Figure 3. Effects of PV+ and SOM+ activation on FI function
a, Example traces showing neuronal spiking evoked by current injection. Red, voltage trace without laser; blue, with laser. Arrowhead, laser onset (laser offset, 800 ms after current injection, not shown). Current amplitude, 0.45 nA (upper) and 1.2 nA (lower). b, FI curve of the cell shown in a. Red, without laser; blue, with laser. Error bar, ±s.e.m. Dashed lines, current amplitudes shown in a. c, d, Summary of threshold (lowest current that evokes spiking) and FI slope with and without laser. Each symbol represents one cell (n=10). e–h, Similar to a–d, for SOM+ activation (n=8).
Figure 4
Figure 4. PV+ activation improves perceptual discrimination
a, Schematic of behavioral experiment. b, Task design. Gray bar, duration of visual stimulation. Black bar, response window. FA, false alarm; CR, correct rejection. c, Changes in Hit and FA rates of PV-ChR2 mice over training (n=25 mice, mean ± s.e.m.). d, Changes in d′ over training, e, d′ vs. Δθ, Data in c–e were collected without laser stimulation. f, Laser-induced change in d′ in PV-ChR2 mice, significant at Δθ = 10° (P=0.008, Wilcoxon signed rank test, 0.032 after Bonferroni correction, n = 9 mice), Δθ = 30° (P=0.011, n=19), and Δθ=90° (P=0.007, n=25). g, Similar to f, for control mice (n=10).

Comment in

References

    1. Markram H, et al. Interneurons of the neocortical inhibitory system. Nature Rev Neurosci. 2004;5:793–807. - PubMed
    1. Xu XM, Roby KD, Callaway EM. Immunochemical characterization of inhibitory mouse cortical neurons: three chemically distinct classes of inhibitory cells. J Comp Neurol. 2010;518:389–404. - PMC - PubMed
    1. Ascoli GA, et al. Petilla terminology: nomenclature of features of GABAergic interneurons of the cerebral cortex. Nature Rev Neurosci. 2008;9:557–568. - PMC - PubMed
    1. Blanche TJ, Spacek MA, Hetke JF, Swindale NV. Polytrodes: high-density silicon electrode arrays for large-scale multiunit recording. J Neurophysiol. 2005;93:2987–3000. - PubMed
    1. Du JG, et al. High-resolution three-dimensional extracellular recording of neuronal activity with microfabricated electrode arrays. J Neurophysiol. 2009;101:1671–1678. - PubMed

Publication types

MeSH terms