. 2012 Oct;40(19):9379-91.
doi: 10.1093/nar/gks725. Epub 2012 Aug 8.

Discovery of multi-dimensional modules by integrative analysis of cancer genomic data

Affiliations

Discovery of multi-dimensional modules by integrative analysis of cancer genomic data

Shihua Zhang et al. Nucleic Acids Res. 2012 Oct.

Abstract

Recent technology has made it possible to simultaneously perform multi-platform genomic profiling (e.g. DNA methylation (DM) and gene expression (GE)) of biological samples, resulting in so-called 'multi-dimensional genomic data'. Such data provide unique opportunities to study the coordination between regulatory mechanisms on multiple levels. However, integrative analysis of multi-dimensional genomics data for the discovery of combinatorial patterns is currently lacking. Here, we adopt a joint matrix factorization technique to address this challenge. This method projects multiple types of genomic data onto a common coordinate system, in which heterogeneous variables weighted highly in the same projected direction form a multi-dimensional module (md-module). Genomic variables in such modules are characterized by significant correlations and likely functional associations. We applied this method to the DM, GE, and microRNA expression data of 385 ovarian cancer samples from the The Cancer Genome Atlas project. These md-modules revealed perturbed pathways that would have been overlooked with only a single type of data, uncovered associations between different layers of cellular activities and allowed the identification of clinically distinct patient subgroups. Our study provides an useful protocol for uncovering hidden patterns and their biological implications in multi-dimensional 'omic' data.


Figures

Figure 1.
Figure 1.
(A) An example of md-modules. In the three data matrices, rows correspond to the samples and columns correspond to different measurements. An md-module consists of r rows and nI (I = 1,2,3) columns for GE, ME and DM data, respectively. These subsets of DMs, MEs and GEs exhibit correlated profiles across a subset of samples. (B) Rationale for the joint NMF approach. Input matrices of methylation, miRNA and GE data are projected onto a new common space, where the three correlated patterns containing different types of genomic measurements are uncovered. (C) Illustration of joint NMF factorization and the three identified md-modules.
Figure 2.
Figure 2.
Illustration of the patterns (md-modules) identified by the adopted method. A simulated dataset with the same number of samples (rows) and different number of features (columns) was generated. The joint NMF method can accurately discover the patterns embedded in these data. A pattern may involve as many as all three datasets simultaneously or only cover two datasets. These different patterns may share the same samples (overlap) or/and the same features.
Figure 3.
Figure 3.
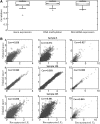
(A) Box-plot of sample-wise correlations of original and reconstructed methylation, miRNA and GE profiles across 385 samples. (B) Original data are plotted against the reconstructed methylation, miRNA and GE profiles for three samples.
Figure 4.
Figure 4.
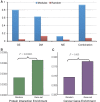
(A) Enrichment ratio of md-modules in each dimension (GE, DM and ME), with respect to the GO biological process terms. For comparison, the mean ratio of functional enrichment for 100 corresponding random runs is also plotted. (B) and (C) Examples of protein interaction enrichment and cancer gene enrichment, which were calculated for md-modules 173. The P-values were determined by right-tailed Fisher's exact test.
Figure 5.
Figure 5.
Multilevel factors cooperatively perturb pathways. (A) Bladder cancer pathway and (B) TGF-β signaling pathway, which are enriched in the combination of molecules in all three dimensions, but not in each dimension. In both subfigures, molecules in this module participating in the corresponding pathways include those from the gene expression dimension (in green), DNA methylation dimension (red), miRNA expression dimension (blue) and miRNA targets (white).
Figure 6.
Figure 6.
(A) and (B) Kaplan–Meier survival analysis for patients associated with module 166 (A) or module 3 (B) compared with other patients. The P-values of the log-rank test were P = 0.0006 and P = 0.019, respectively. Median survivals for patients in module 166 or module 3 compared with other patients were 26.4 versus 36.1 years and 38.2 versus 33.8 years, respectively. (C) and (D) Box-plot for the ages of patients associated with module 28 (C) or module 78 (D) compared with other patients. The P-values of the rank-sum test were P = 0.009 and P = 0.002, respectively. Median ages for patients in module 28 or module 78 compared with other patients were 66.3 versus 58.7 years and 54.1 versus 60.2 years, respectively.

References

    1. Cancer Genome Atlas Research Network. Comprehensive genomic characterization defines human glioblastoma genes and core pathways. Nature. 2008;455:1061–1068. - PMC - PubMed
    1. Weinstein JN, Myers TG, O'Connor PM, Friend SH, Fornace AJ, Jr, Kohn KW, Fojo T, Bates SE, Rubinstein LV, Anderson NL, et al. An information-intensive approach to the molecular pharmacology of cancer. Science. 1997;275:343–349. - PubMed
    1. Bussey KJ, Chin K, Lababidi S, Reimers M, Reinhold WC, Kuo WL, Gwadry F, Ajay, Kouros-Mehr H, Fridlyand J, et al. Integrating data on DNA copy number with gene expression levels and drug sensitivities in the NCI-60 cell line panel. Mol. Cancer Ther. 2006;5:853–867. - PMC - PubMed
    1. Scherf U, Ross DT, Waltham M, Smith LH, Lee JK, Tanabe L, Kohn KW, Reinhold WC, Myers TG, Andrews DT, et al. A gene expression database for the molecular pharmacology of cancer. Nat. Genet. 2000;24:236–244. - PubMed
    1. Staunton JE, Slonim DK, Coller HA, Tamayo P, Angelo MJ, Park J, Scherf U, Lee JK, Reinhold WO, Weinstein JN, et al. Chemosensitivity prediction by transcriptional profiling. Proc. Natl Acad. Sci. USA. 2001;98:10787–10792. - PMC - PubMed

Publication types