

doi: 10.1126/science.1223154.
Closed-loop control of epilepsy by transcranial electrical stimulation
Affiliations
- PMID: 22879515
- PMCID: PMC4908579
- DOI: 10.1126/science.1223154
Item in Clipboard
Closed-loop control of epilepsy by transcranial electrical stimulation
Science.
.
Abstract
Many neurological and psychiatric diseases are associated with clinically detectable, altered brain dynamics. The aberrant brain activity, in principle, can be restored through electrical stimulation. In epilepsies, abnormal patterns emerge intermittently, and therefore, a closed-loop feedback brain control that leaves other aspects of brain functions unaffected is desirable. Here, we demonstrate that seizure-triggered, feedback transcranial electrical stimulation (TES) can dramatically reduce spike-and-wave episodes in a rodent model of generalized epilepsy. Closed-loop TES can be an effective clinical tool to reduce pathological brain patterns in drug-resistant patients.
Figures
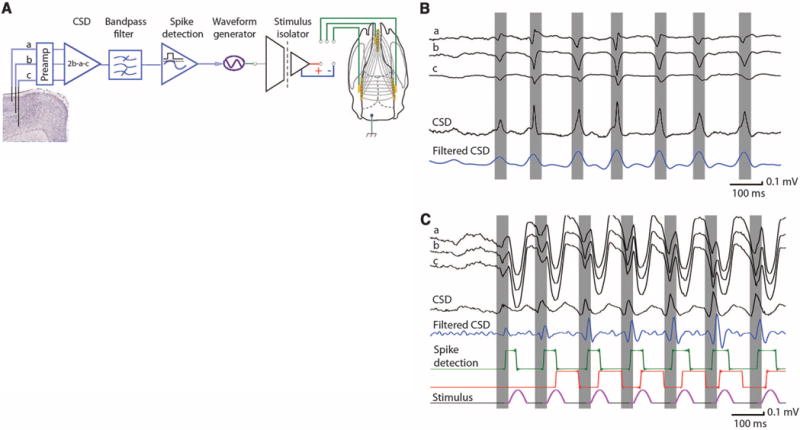
Experimental setup. (A) Artifact reduction by means of tripolar recordings of LFP and unit activity in superficial, mid-, and deep cortical layers. CSD is derived from the three signals (LFPs from channels a and c are subtracted from the 2× amplitude of channel b activity). The derived CSD signal is filtered (10 to 130 Hz), and signals exceeding the predetermined amplitude threshold are detected (spike detection). The thresholded signals are used to trigger TES, applied to the skull either in a bipolar configuration (left versus right hemispheres) or frontal midline versus parietal areas (as shown). (B) Example of LFP signal during a spontaneously occurring SW episode, CSD, and its filtered version in the absence of TES stimulation. (C) Similar SW episode in the presence of TES stimulation. The gating (red) “dead time” pulse (80 ms) was used to prevent prolonged spurious triggering of the stimulator during the wave components of SW episode.
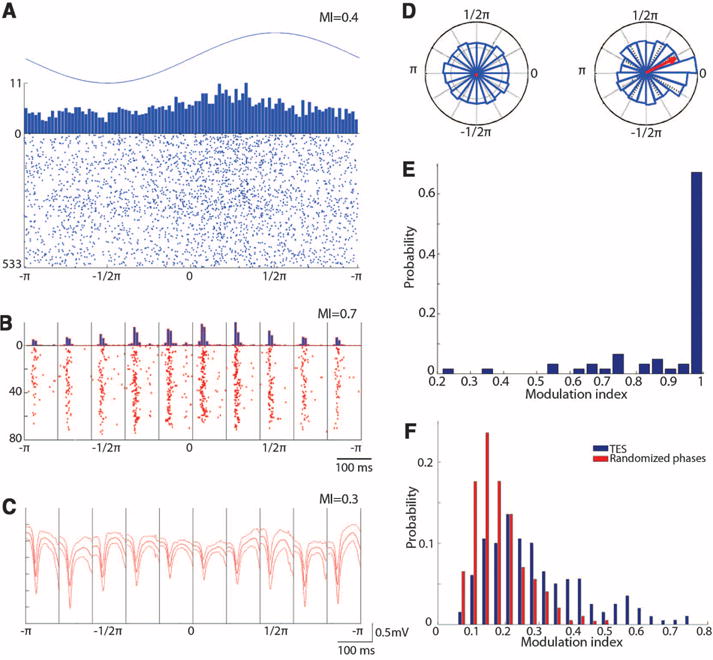
TES modulates cortical neuronal firing and spike component of SW. (A) Raster plot and histogram of multiple-unit firing during interictal 1-Hz TES (sinus). (B) Because both TES and SW strongly modulated unit firing, SW-related discharge was calculated in 10 bins (100-ms windows), using the spike component as reference in each bin. TES-induced cyclic modulation of multiple-unit firing during SW is shown. (C) TES modulation of the LFP spike of SW [different rat from (A) and (B)] and mean and SD of SW in each bin. (D) Polar plots of the magnitude of the LFP spike component in the absence (left, random phase) and presence of TES (right). (A) to (D) are single-session examples. (E) Group data showing the effectiveness of TES stimulation on unit-firing modulation during SW patterns. Modulation index (MI) of 1 corresponds to sessions in which TES completely silenced MUA in at least one bin. (F) Distribution of MI of the LFP spike amplitude compared with randomly shuffling the relationship between LFP spike amplitude and TES phase in all sessions and rats (n = 9 rats).
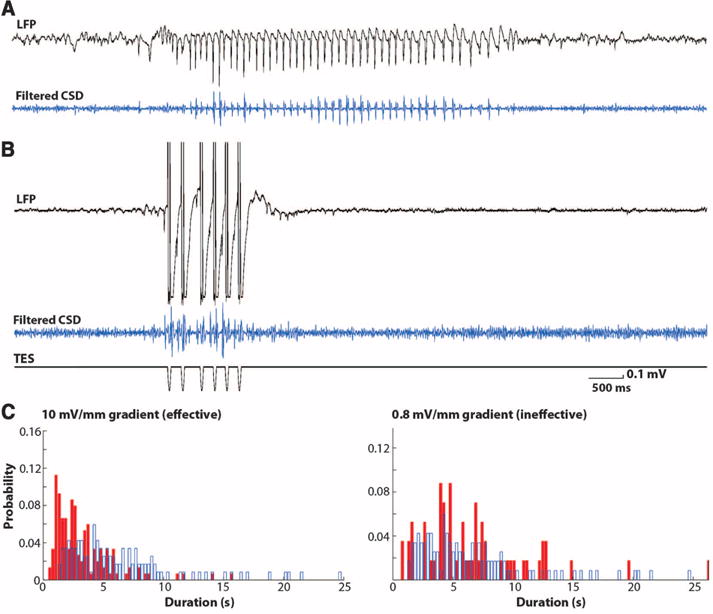
Closed-loop feedback TES stimulation aborts SW episodes. (A and B) SW episodes (LFP and filtered CSD traces) without (top) and with (bottom) feedback TES. (C) Distribution of the duration of SW episodes in the absence (control, blue) and presence of feedback TES. Shown are data from two example sessions with effective (10 mV/mm voltage gradient intensity) and ineffective, subthreshold (0.8 mV/mm) TES stimulation.
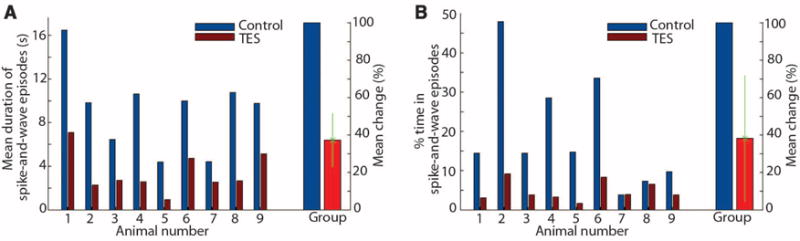
Closed-loop feedback TES stimulation aborts SW episodes. (A) Mean duration of SW episodes in each of the nine rats tested and the group mean (and SD). (B) Percent time spent in SW episodes in a given recording session. Shown are results from individual rats and group. Mean percent change refers to group data.
References
Publication types
MeSH terms
Grants and funding
LinkOut - more resources
Full Text Sources
Other Literature Sources
Medical
