. 2012 Oct 5;287(41):34660-82.
doi: 10.1074/jbc.M112.373241. Epub 2012 Aug 9.

Evidence for bidirectional endocannabinoid transport across cell membranes

Affiliations

Evidence for bidirectional endocannabinoid transport across cell membranes

Andrea Chicca et al. J Biol Chem. .

Abstract

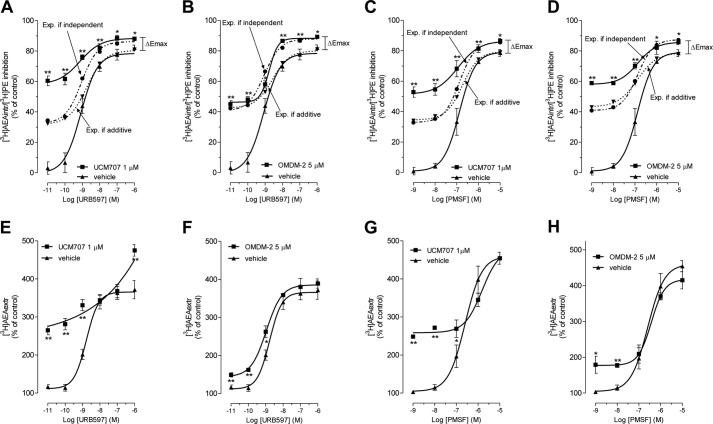
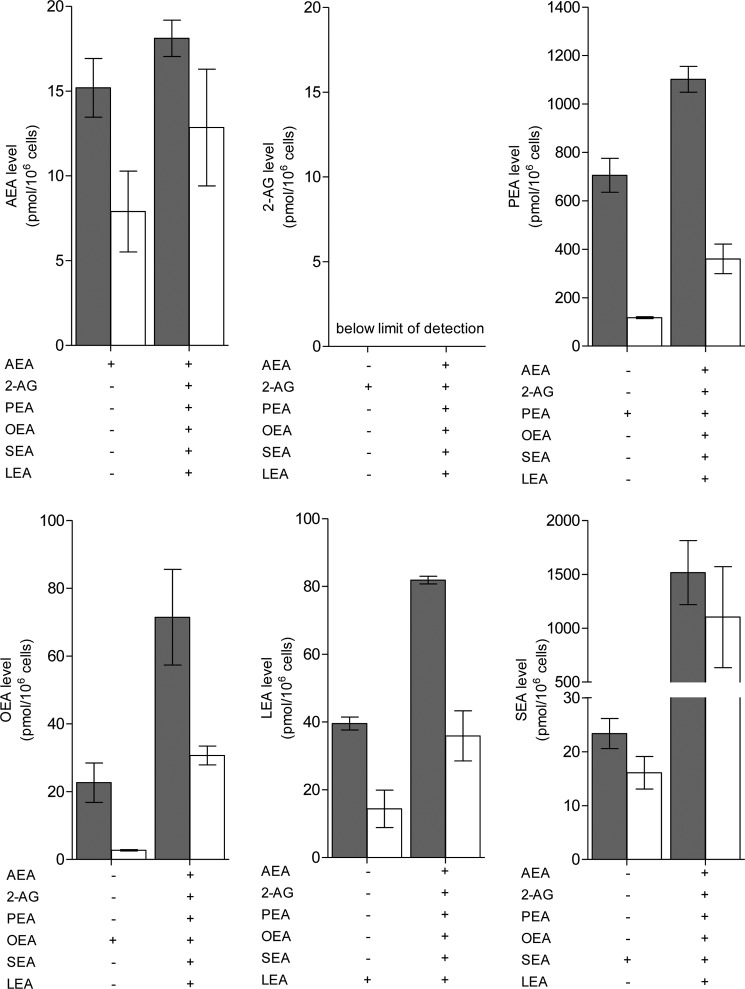
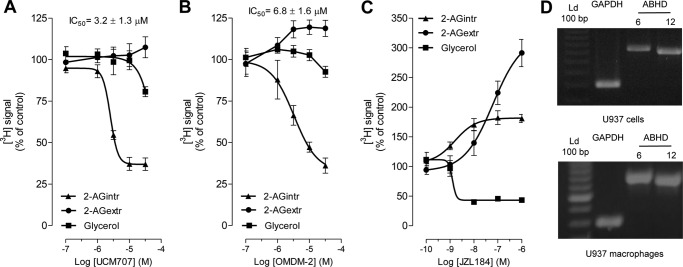
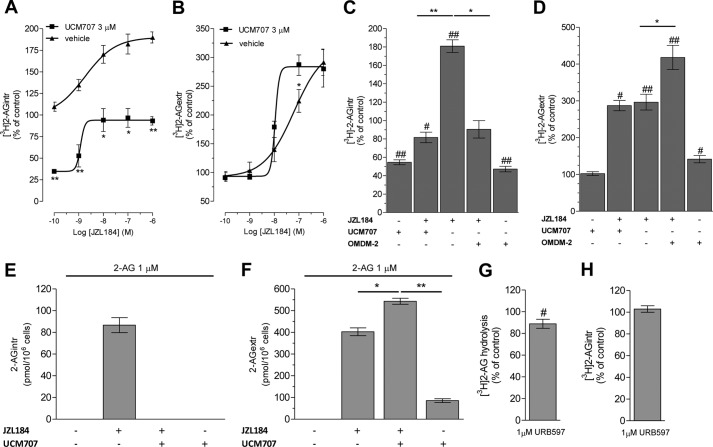
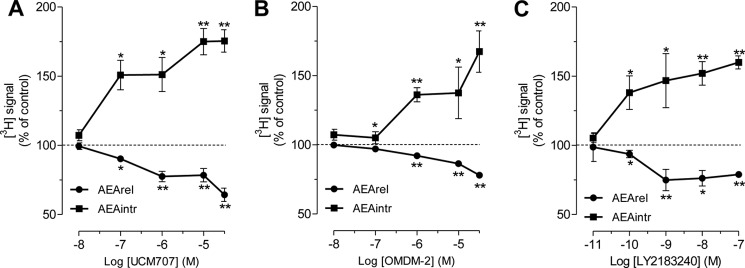
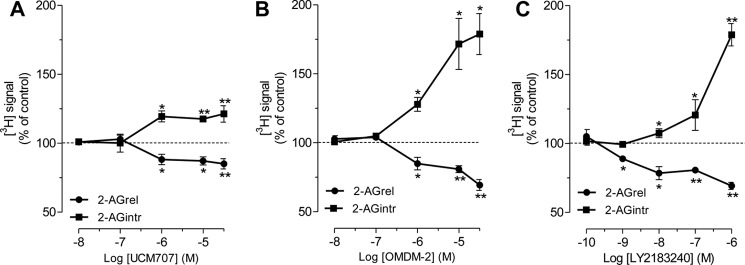
Despite extensive research on the trafficking of anandamide (AEA) across cell membranes, little is known about the membrane transport of other endocannabinoids, such as 2-arachidonoylglycerol (2-AG). Previous studies have provided data both in favor and against a cell membrane carrier-mediated transport of endocannabinoids, using different methodological approaches. Because AEA and 2-AG undergo rapid and almost complete intracellular hydrolysis, we employed a combination of radioligand assays and absolute quantification of cellular and extracellular endocannabinoid levels. In human U937 leukemia cells, 100 nm AEA and 1 μm 2-AG were taken up through a fast and saturable process, reaching a plateau after 5 min. Employing differential pharmacological blockage of endocannabinoid uptake, breakdown, and interaction with intracellular binding proteins, we show that eicosanoid endocannabinoids harboring an arachidonoyl chain compete for a common membrane target that regulates their transport, whereas other N-acylethanolamines did not interfere with AEA and 2-AG uptake. By combining fatty acid amide hydrolase or monoacyl glycerol lipase inhibitors with hydrolase-inactive concentrations of the AEA transport inhibitors UCM707 (1 μm) and OMDM-2 (5 μm), a functional synergism on cellular AEA and 2-AG uptake was observed. Intriguingly, structurally unrelated AEA uptake inhibitors also blocked the cellular release of AEA and 2-AG. We show, for the first time, that UCM707 and OMDM-2 inhibit the bidirectional movement of AEA and 2-AG across cell membranes. Our findings suggest that a putative endocannabinoid cell membrane transporter controls the cellular AEA and 2-AG trafficking and metabolism.


Figures

FIGURE 1.
FIGURE 1.
Kinetic measurements (30 s to 60 min) of the intracellular and extracellular AEA and 2-AG levels. A, time-dependent increase of intracellular [3H]AEA (AEAintr), decrease of extracellular [3H]AEA (AEAextr) and [3H]ethanolamine (EtNH2) formation after incubation of 100 nm [3H]AEA plus AEA in U937 cells (106 cells). B, time-dependent increase of intracellular [3H]2-AG (2-AGintr), decrease of extracellular [3H]2-AG (2-AGextr), and [3H]glycerol formation after the incubation of 1 μm [3H]2-AG plus 2-AG with U937 cells (106 cells). C, TLC analysis of the cellular radioactivity originating from the addition of [3H]AEA in U937 cells. Most of the radioactivity was found in PE-incorporated [3H]ethanolamine and only little as intact [3H]AEA. D, TLC analysis of the cellular radioactivity originating from the addition of [3H]2-AG in U937 cells. Almost all of the radioactivity was found as intact [3H]2-AG. E, time-dependent increase of intracellular [3H]AEA, decrease of extracellular [3H]AEA, and [3H]ethanolamine formation after the incubation of 100 nm of [3H]AEA plus AEA in U937 cells. F, kinetic measurement (1–30 min) of the absolute intracellular and extracellular AEA levels after the incubation of 100 nm AEA in U937 cells and U937 macrophages (106 cells). The values are expressed as pmol of AEA, 2-AG, EtNH2, or glycerol per 106 cells. The radioactive signal for [3H]ethanolamine and [3H]glycerol represents the sum of the radioactivity recovered in the aqueous phases coming from cells and supernatant. Data show mean values ± S.E. (error bars) of three independent experiments, each one carried out at least in triplicates.
FIGURE 2.
FIGURE 2.
A–D, cellular [3H]AEA uptake inhibition and extracellular [3H]AEA accumulation after 5-min incubation with 100 nm [3H]AEA plus AEA and 20-min pretreatment with UCM707 (A), OMDM-2 (B), URB597 (C), and PMSF (D) in U937 cells (106 cells). For URB597 (C) and PMSF (D), the [3H]ethanolamine (EtNH2) inhibition curve is also shown. The IC50 values were calculated from the AEA uptake inhibition curves. E, kinetic measurement of [3H]AEA uptake inhibition calculated after different times of incubation (from 30 s to 10 min) with 100 nm [3H]AEA plus AEA and 20-min pretreatment with 1 μm UCM707 or 5 μm OMDM-2 in U937 cells (106 cells). All values are expressed as a percentage of vehicle-treated control. The values are expressed as mean ± S.E. (error bars) of three independent experiments, each carried out in at least triplicates. No statistically significant difference was observed in the inhibition potency of 1 μm UCM707 (∼32%) and 5 μm OMDM-2 (∼40%) in the whole time range.
FIGURE 3.
FIGURE 3.
Concentration-dependent [3H]AEA uptake inhibition induced by FAAH inhibitors alone or in combination with UCM707 or OMDM-2. Cellular [3H]AEA uptake inhibition after a 5-min incubation of 100 nm [3H]AEA plus AEA and 20-min pretreatment with URB597 alone and in the presence of 1 μm UCM707 (A) or 5 μm OMDM-2 (B) in U937 cells (106 cells). In every graph, the theoretical curves for additivity and independent interaction are shown as dotted lines. Curves were calculated, applying a model based on the assumption that the two compounds act either on the same target (additivity) or on different targets (independent interaction). See “Experimental Procedures” for details. The same [3H]AEA uptake inhibition curve was measured after a 20-min pretreatment with PMSF alone or in the presence of 1 μm UCM707 (C) or 5 μm OMDM-2 (D). The concentration-dependent extracellular [3H]AEA accumulation measured in the same experimental conditions is shown for URB597 alone and in the presence of 1 μm UCM707 (E) or 5 μm OMDM-2 (F) and for PMSF alone and in the presence of 1 μm UCM707 (G) or 5 μm OMDM-2 (H). The values are expressed as a percentage of cellular or extracellular [3H]AEA levels as compared with vehicle-treated control. Data show mean values ± S.E. (error bars) of three independent experiments, each one carried out at least in triplicate. *, p < 0.05; **, p < 0.01, combination treatment versus URB597 or PMSF alone.
FIGURE 4.
FIGURE 4.
Cellular and extracellular AEA levels measured by GC/MS in the presence of FAAH inhibitors alone or in combination with UCM707 or OMDM-2. A, intracellular AEA level measured after a 5-min incubation of 100 nm AEA and 20-min pretreatment with 100 nm URB597 alone and in the presence of 1 μm UCM707 or 5 μm OMDM-2 in U937 cells (106 cells). B, the same experiments were carried out in the presence of 1 μm PMSF. In both cases, the intracellular accumulation of AEA induced by URB597 and PMSF was completely abolished in the presence of an EMT inhibitor. In the same experimental conditions, the extracellular AEA accumulation was measured after pretreatment with URB597 alone and in the presence of 1 μm UCM707 or 5 μm OMDM-2 (C) or with PMSF alone and in combination (D). The values are expressed as a percentage of cellular or extracellular AEA level as compared with vehicle-treated control. Data show mean values ± S.E. (error bars) of three independent experiments, each one carried out at least in triplicate. *, p < 0.05; **, p < 0.01, treated versus vehicle-treated control. #, p < 0.05; ##, p < 0.01, combination treatment versus URB597 or PMSF alone.
FIGURE 5.
FIGURE 5.
Concentration-dependent [3H]AEA uptake inhibition and extracellular accumulation induced by different inhibitors in U937 macrophages. Shown are intracellular [3H]AEA uptake inhibition (A) and extracellular [3H]AEA accumulation (B) measured after a 5-min incubation of 100 nm [3H]AEA plus AEA and 20-min pretreatment with UCM707 or OMDM-2 in U937 macrophages (106 cells). The IC50 values were calculated from the [3H]AEA uptake inhibition curve. C, the same experiments were carried out by pretreating U937 macrophages with different concentrations of URB597. D, the concentration-dependent cellular [3H]AEA uptake inhibition induced by the FABP inhibitor BMS309403 was measured in U937 cells and U937 macrophages. The IC50 values of BMS309403 calculated for the two cell types are reported in the graph. *, p < 0.05; **, p < 0.01 intracellular [3H]AEA level in U937 macrophages versus U937 cells. Error bars, S.E.
FIGURE 6.
FIGURE 6.
AEA and 2-AG competition for the cellular uptake in U937 cells. A, concentration-dependent cellular [3H]AEA uptake inhibition and extracellular [3H]AEA accumulation after 5-min incubation of 100 nm [3H]AEA plus AEA in the presence of different concentrations of 2-AG (0.01–5 μm) in U937 cells (106 cells). B, intracellular and extracellular AEA levels measured by CG/MS after a 5-min incubation with 100 nm AEA in the presence of different concentrations of 2-AG (0.1–5 μm) in U937 cells (106 cells). C, concentration-dependent cellular [3H]2-AG uptake inhibition and extracellular [3H]2-AG accumulation after a 5-min incubation of 1 μm [3H]2-AG plus 2-AG in the presence of different concentrations of AEA (0.01–10 μm) in U937 cells. D, intracellular and extracellular 2-AG levels measured by CG/MS after a 5-min incubation with 1 μm 2-AG in the presence of 0.1–10 μm AEA in U937 cells (106 cells). The values are expressed as a percentage of cellular and extracellular [3H]AEA or [3H]2-AG levels as compared with vehicle-treated control. For the absolute endocannabinoid quantification, the values are expressed as pmol of AEA or 2-AG/106 cells. Data show mean values ± S.E. (error bars) of three independent experiments, each one carried out at least in triplicate. *, p < 0.05; **, p < 0.01, treated versus vehicle-treated control.
FIGURE 7.
FIGURE 7.
Other N-acylethanolamines do not compete with AEA and 2-AG for the cellular uptake in U937 cells. Shown are intracellular (gray bars) and extracellular (white bars) AEA, 2-AG, PEA, OEA, LEA, and SEA levels measured (by GC/MS) alone or in combination after a 5-min incubation of 100 nm AEA and/or 1 μm 2-AG and/or 1 μm PEA and/or 100 nm OEA and/or 100 nm LEA and/or 100 nm SEA in U937 cells (106 cells). The levels of 2-AG were below the limit of detection. The values are expressed as pmol of compound/106 cells. Data show mean values ± S.E. (error bars) of three independent experiments, each one carried out at least in triplicate.
FIGURE 8.
FIGURE 8.
All endocannabinoids compete with AEA and 2-AG for the cellular uptake in U937 cells. Shown are concentration-dependent cellular [3H]AEA or [3H]2-AG uptake inhibition and extracellular [3H]AEA or [3H]2-AG accumulation after a 5-min incubation of 100 nm [3H]AEA plus AEA or 1 μm [3H]2-AG plus 2-AG in the presence of different concentrations of NADA (A), virodhamine (B), and noladin ether (2-AGE) (C) in U937 cells (106 cells). D, intracellular and extracellular [3H]AEA or [3H]2-AG levels and [3H]EtNH2 or [3H]glycerol levels after a 5-min incubation of 100 nm [3H]AEA plus AEA or 1 μm [3H]2-AG plus 2-AG in the presence of 10 μm PEA in U937 cells. The values are expressed as a percentage of cellular and extracellular [3H]AEA or [3H]2-AG levels and [3H]EtNH2 or [3H]glycerol levels as compared with vehicle-treated control. Data show mean values ± S.E. (error bars) of three independent experiments, each one carried out at least in triplicate. *, p < 0.05; **, p < 0.01, treated versus vehicle-treated control.
FIGURE 9.
FIGURE 9.
Concentration-dependent [3H]2-AG uptake inhibition and extracellular accumulation induced by UCM707, OMDM-2, and JZL184 in U937 cells. Shown are concentration-dependent cellular [3H]2-AG, extracellular [3H]2-AG, and [3H]glycerol levels after a 5-min incubation of 1 μm [3H]2-AG plus 2-AG in the presence of different concentrations of UCM707 (A), OMDM-2 (B), and JZL184 (C) in U937 cells (106 cells). The values are expressed as a percentage of cellular and extracellular [3H]2-AG level and [3H]glycerol level as compared with vehicle-treated control. The radioactive signal for [3H]glycerol represents the sum of the radioactivity recovered in the aqueous phases coming from cell and supernatant. Data show mean values ± S.E. (error bars). of three independent experiments, each one carried out at least in triplicate. D, RT-PCR characterization of ABHD expression in U937 cells (top) and U937 macrophages (bottom). Total RNA was extracted from 5 × 10⁶ cells, and mRNA expression was examined by RT-PCR. The expected sizes of the RT-PCR products are 300 bp for GAPHD, 673 bp for ABHD-6, and 638 bp for ABHD-12.
FIGURE 10.
FIGURE 10.
Concentration-dependent [3H]2-AG uptake accumulation induced by JZL184 alone or in combination with 3 μm UCM707. A, concentration-dependent cellular [3H]2-AG uptake inhibition after a 5-min incubation of 1 μm [3H]2-AG plus 2-AG and 20-min pretreatment with JZL184 alone and in the presence of 3 μm UCM707 in U937 cells (106 cells). B, the concentration-dependent extracellular [3H]2-AG accumulation measured in the same experimental conditions is shown for JZL184 alone or in the presence of 3 μm UCM707. Shown are cellular [3H]2-AG uptake inhibition (C) and extracellular [3H]2-AG accumulation (D) after a 5-min incubation with 1 μm [3H]2-AG plus 2-AG and 20-min pretreatment with 1 μm UCM707, 5 μm OMDM-2, and 1 μm JZL184 alone or in combinations in U937 cells. Shown are intracellular (E) and extracellular (F) 2-AG levels measured (by GC/MS) after a 5-min incubation of 1 μm 2-AG and a 20-min pretreatment with 1 μm JZL184 and 3 μm UCM707 alone or in combination in U937 cells. Shown are [3H]2-AG hydrolysis (measured in U937 cell homogenate) (G) and cellular [3H]2-AG uptake (measured in U937 cells) (H) in the presence of 1 μm URB597. The values are expressed as a percentage of cellular or extracellular [3H]2-AG level as compared with vehicle-treated control. For the absolute 2-AG quantification, the values are expressed as pmol/106 cells. Data show mean values ± S.E. (error bars) of three independent experiments, each one carried out at least in triplicate. #, p < 0.05; ##, p < 0.01 versus control. *, p < 0.05; **, p < 0.01 combination treatment versus JZL184 alone.
FIGURE 11.
FIGURE 11.
EMT inhibitors block [3H]AEA release from U937 cells preloaded with 100 nm [3H]AEA plus AEA. Shown are concentration-dependent intracellular [3H]AEA (AEAintr) accumulation and extracellular [3H]AEA released (AEArel) reduction after a 25-min incubation of UCM707 (A), OMDM-2 (B), or LY2183240 (C) in FAAH-blocked U937 cells (obtained by cellular pretreatment with 100 nm URB597 and 1 μm PMSF) preloaded with 100 nm [3H]AEA plus AEA. The values are expressed as a percentage of cellular or extracellular [3H]AEA levels as compared with vehicle-treated control. Data show mean values ± S.E. (error bars) of three independent experiments, each one carried out at least in triplicate. *, p < 0.05; **, p < 0.01, treated versus vehicle-treated control.
FIGURE 12.
FIGURE 12.
EMT inhibitors inhibit [3H]2-AG release from U937 cells preloaded with 1 μm [3H]2-AG plus 2-AG. Shown are concentration-dependent intracellular [3H]2-AG (2-AGintr) accumulation and extracellular [3H]2-AG released (2-AGrel) reduction after a 25-min incubation with UCM707 (A), OMDM-2 (B), or LY2183240 (C) in MAGL-, ABHD-6-, and ABHD-12-blocked U937 cells (obtained by cellular pretreatment with 1 μm JZL184, 10 μm WWL70, and 20 μm tetrahydrolipstatin) preloaded with 1 μm [3H]2-AG plus 2-AG. The values are expressed as a percentage of cellular or extracellular [3H]2-AG levels as compared with vehicle-treated control. Data show mean values ± S.E. (error bars) of three independent experiments, each one carried out at least in triplicate. *, p < 0.05; **, p < 0.01, treated versus vehicle-treated control.

References

    1. Di Marzo V. (2008) Targeting the endocannabinoid system. To enhance or reduce? Nat. Rev. Drug Discov. 7, 438–455 - PubMed
    1. Battista N., Di Tommaso M., Bari M., Maccarrone M. (2012) The endocannabinoid system. An overview. Front. Behav. Neurosci. 6, 9. - PMC - PubMed
    1. Cravatt B. F., Giang D. K., Mayfield S. P., Boger D. L., Lerner R. A., Gilula N. B. (1996) Molecular characterization of an enzyme that degrades neuromodulatory fatty acid amides. Nature 384, 83–87 - PubMed
    1. Dinh T. P., Carpenter D., Leslie F. M., Freund T. F., Katona I., Sensi S. L., Kathuria S., Piomelli D. (2002) Brain monoglyceride lipase participating in endocannabinoid inactivation. Proc. Natl. Acad. Sci. U.S.A. 99, 10819–10824 - PMC - PubMed
    1. Ueda N., Yamanaka K., Yamamoto S. (2001) Purification and characterization of an acid amidase selective for N-palmitoylethanolamine, a putative endogenous anti-inflammatory substance. J. Biol. Chem. 276, 35552–35557 - PubMed

Publication types

MeSH terms

LinkOut - more resources