. 2012;7(8):e42056.
doi: 10.1371/journal.pone.0042056. Epub 2012 Aug 6.

Complete mitochondrial genome of the free-living earwig, Challia fletcheri (Dermaptera: Pygidicranidae) and phylogeny of Polyneoptera

Affiliations

Complete mitochondrial genome of the free-living earwig, Challia fletcheri (Dermaptera: Pygidicranidae) and phylogeny of Polyneoptera

Xinlong Wan et al. PLoS One. 2012.

Abstract

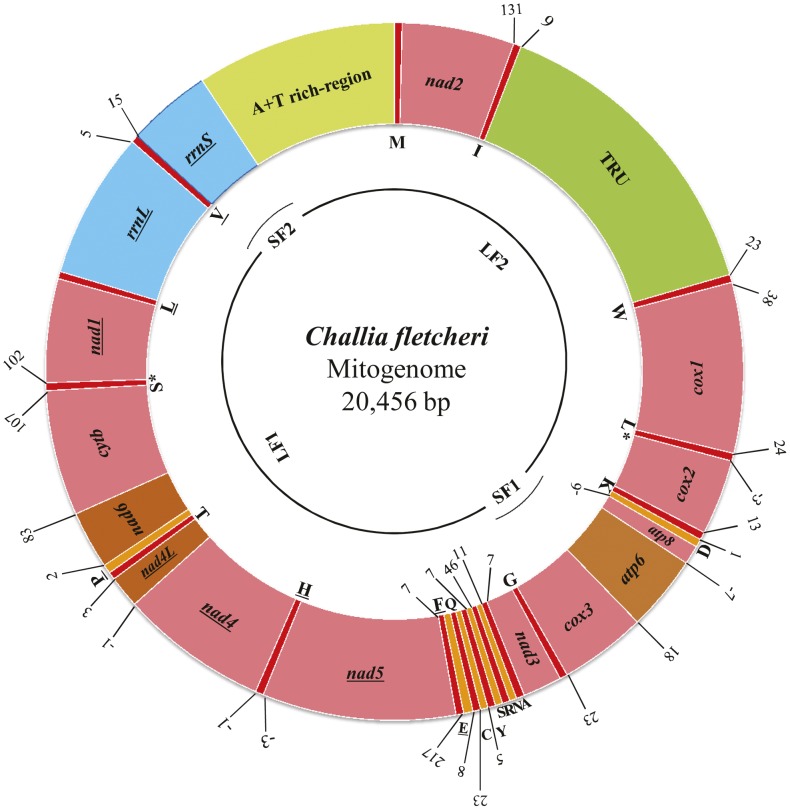
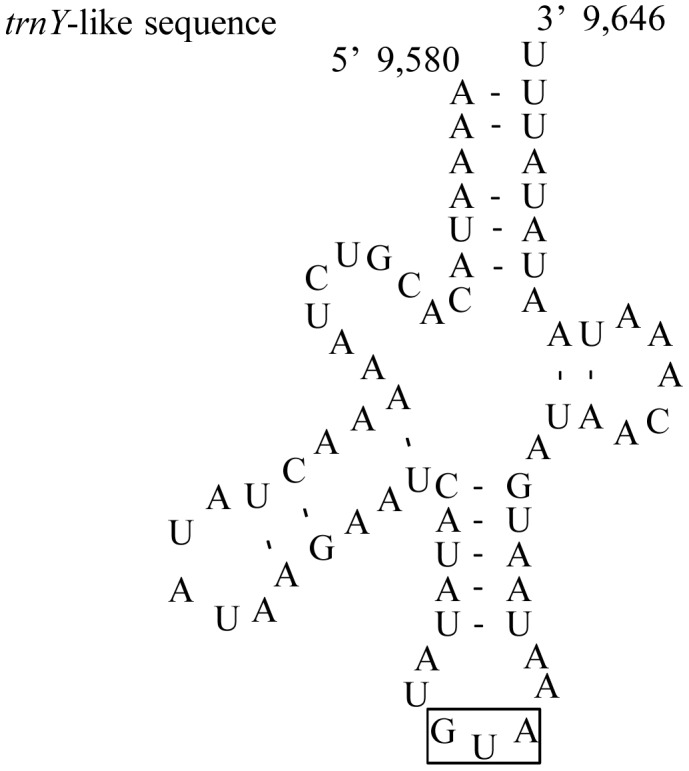
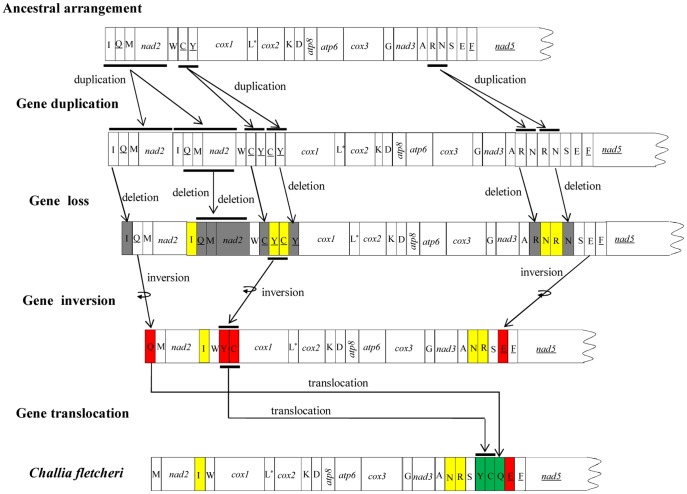
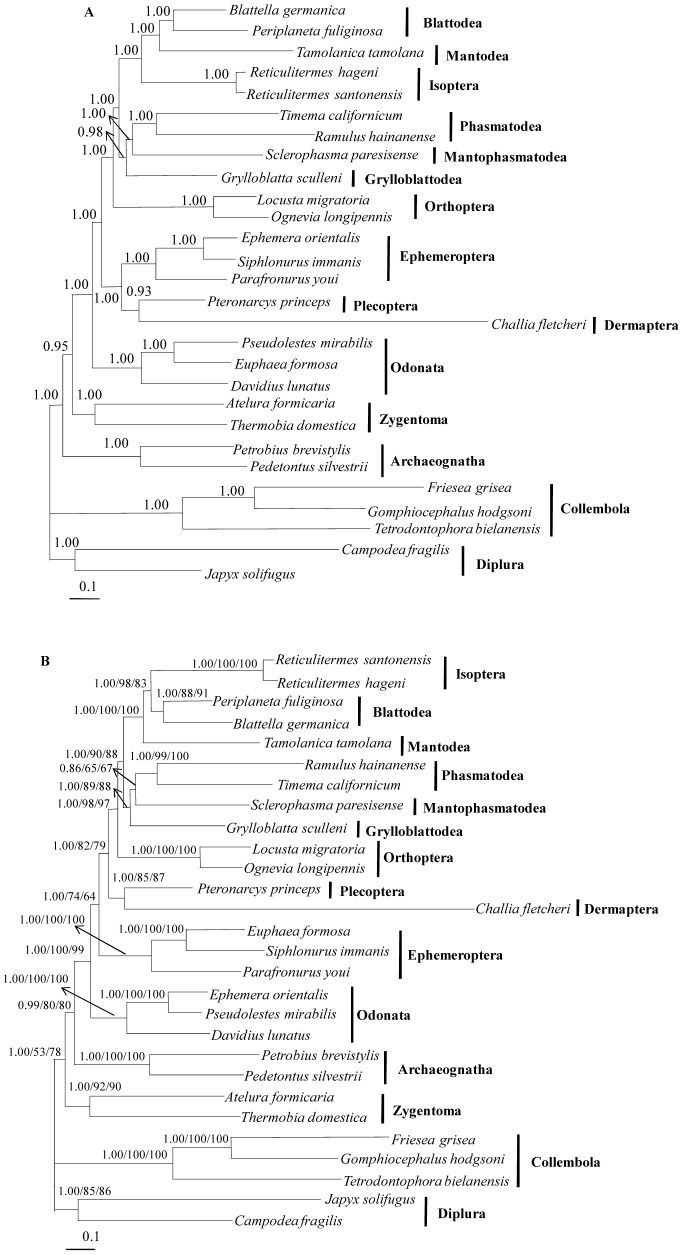
The insect order Dermaptera, belonging to Polyneoptera, includes ∼2,000 extant species, but no dermapteran mitochondrial genome has been sequenced. We sequenced the complete mitochondrial genome of the free-living earwig, Challia fletcheri, compared its genomic features to other available mitochondrial sequences from polyneopterous insects. In addition, the Dermaptera, together with the other known polyneopteran mitochondrial genome sequences (protein coding, ribosomal RNA, and transfer RNA genes), were employed to understand the phylogeny of Polyneoptera, one of the least resolved insect phylogenies, with emphasis on the placement of Dermaptera. The complete mitochondrial genome of C. fletcheri presents the following several unusual features: the longest size in insects is 20,456 bp; it harbors the largest tandem repeat units (TRU) among insects; it displays T- and G-skewness on the major strand and A- and C-skewness on the minor strand, which is a reversal of the general pattern found in most insect mitochondrial genomes, and it possesses a unique gene arrangement characterized by a series of gene translocations and/or inversions. The reversal pattern of skewness is explained in terms of inversion of replication origin. All phylogenetic analyses consistently placed Dermaptera as the sister to Plecoptera, leaving them as the most basal lineage of Polyneoptera or sister to Ephemeroptera, and placed Odonata consistently as the most basal lineage of the Pterygota.


Conflict of interest statement

Competing Interests: The authors have declared that no competing interests exist.

Figures

Figure 1
Figure 1. Circular map of the mitochondrial genome of C. fletcheri.
tRNAs are denoted as one-letter symbols consistent with the IUPAC/IUB single letter codes for amino acids, with L  =  trnL(CUN); L*  =  trnL(UUR); S  =  trnS(AGN); S*  =  trnS(UCN). TRU indicates the tandem repeat unit. Gene names that are not underlined indicate a clockwise transcriptional direction, whereas underlines indicate a counter-clockwise transcriptional direction. Numbers show the sizes of intergenic spacers (positive values) and overlapping region between genes (negative values). The C. fletcheri mitochondrial genome was sequenced by 2 overlapping short (SF1 and SF2) and long (LF1 and LF2) fragments, as shown in a single line within the circle.
Figure 2
Figure 2. Predicted secondary structures for the 22 tRNA genes of C. fletcheri.
Dashes (–) indicate Watson-Crick base-pairing and centered dots (•) indicate G-U base-pairing. Arms of tRNAs (clockwise from top) are the amino acid acceptor (AA) arm, TψC (T) arm, the anticodon (AC) arm, and the dihydrouridine (DHU) arm.
Figure 3
Figure 3. Tandem repeat units and tRNA-like sequences found in the A+T-rich region of C. fletcheri.
(A) The A+T-rich region sequence of C. fletcheri; (B) Predicted secondary structures for 3 tRNA-like sequences found in the A+T-rich region. The sequences covered by green and yellow are tandem repeat units; the single underline and double underlines indicate trnI-like and trnY-like sequences, respectively; the italic nucleotides indicate trnD-like sequences; the rectangular boxes indicate the respective anticodons, and the nucleotide position is indicated at the beginning and end sites of the sequence.
Figure 4
Figure 4. Tandem repeat units (TRU) and secondary structures of trnL(UUR)-like and trnA-like sequences found in the TRU.
(A) TRU; (B) The secondary structures of trnL(UUR)-like and trnA-like sequences found in the TRU. The sequences covered by yellow and green indicate each repeat unit; the underlined sequences indicate trnL(UUR)-like sequences; the italic nucleotides indicate trnA-like sequences; the rectangular boxes indicate the respective anticodons, and the nucleotide position is indicated at the beginning and end sites of the sequence.
Figure 5
Figure 5. Predicted secondary structure for trnY-like sequence found in intergenic spacer between trnE and trnF.
The rectangular boxes indicate the respective anticodons, and the nucleotide position is indicated at the beginning and end sites of the structures.
Figure 6
Figure 6. Schematic illustration of each event for mitochondrial gene rearrangement in C. fletcheri.
Gene sizes are not drawn to scale. Gene names that are not underlined indicate a forward transcriptional direction, whereas underlines indicate a reverse transcriptional direction. tRNA genes are abbreviated using the one-letter amino acid code, with L*  =  trnL(UUR); S  =  trnS(AGN). White boxes represent genes with the same relative position as in the ancestral insect arrangement pattern. Yellow boxes represent gene translocations; red boxes represent gene inversions; green boxes represent gene shuffling with remote inversions compared to the ancestral insect arrangement. The grey boxes represent gene deletions. The remaining genes and gene orders identical to the ancestral insect are omitted. Each rearrangement event was independent, so there is no way of determining the order of event.
Figure 7
Figure 7. Phylogeny of polyneopteran orders. (
A) Bayesian inference phylogeny obtained with the dataset PCG123RNA; (B) Bayesian inference phylogeny obtained with the dataset PCG12RNA. The numbers associated with the nodes are posterior probabilities obtained by BI analysis with the dataset PCG12RNA (first) or bootstrap values obtained by ML analysis with the dataset PCG12RNA (second) and ML analysis with the dataset PCG123RNA (third). The species of Collembola and Diplura were utilized as outgroups to root the trees. The scale bar indicates the number of substitutions per site.

Similar articles

Cited by

References

    1. Brown WM (1985) The mitochondrial genome of animals. In: Macintyre RJ, editor. Molecular Evolution Genetics. New York: Plenum.
    1. Boore JL (1999) Animal mitochondrial genomes. Nucleic Acids Res 27: 1767–1780. - PMC - PubMed
    1. Wolstenholme DR (1992) Animal mitochondrial DNA: structure and evolution. Int Rev Cytol 141: 173–216. - PubMed
    1. Boyce TM, Zwick ME, Aquadro CF (1989) Mitochondrial DNA in the bark weevils: size, structure and heteroplasmy. Genetics 123: 825–836. - PMC - PubMed
    1. Fauron CMR, Wolestenholme DR (1980) Extensive diversity among Drosophilla species with respect to nucleotide sequences within the adenine + thymine-rich region of mitochondrial DNA molecules. Nucleic Acids Res 8: 2439–2452. - PMC - PubMed

Publication types

Associated data