

Role of the Irr protein in the regulation of iron metabolism in Rhodobacter sphaeroides
- PMID: 22879920
- PMCID: PMC3413700
- DOI: 10.1371/journal.pone.0042231
Role of the Irr protein in the regulation of iron metabolism in Rhodobacter sphaeroides
Abstract
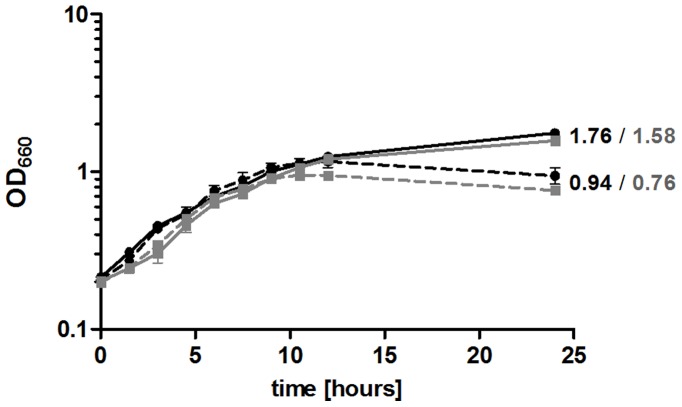
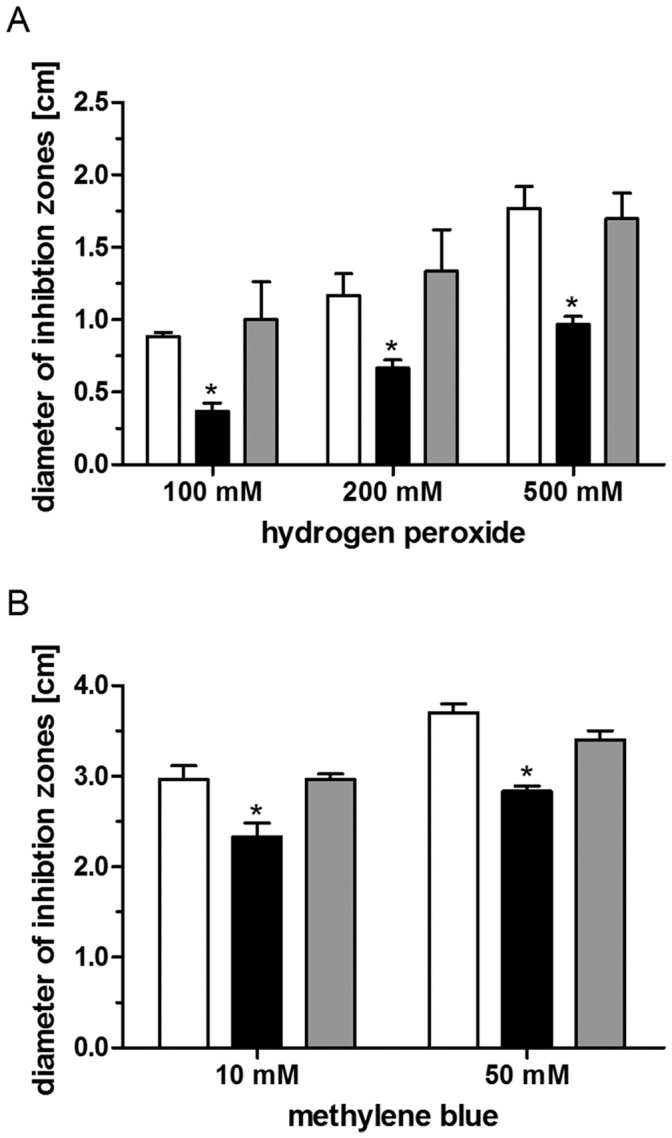
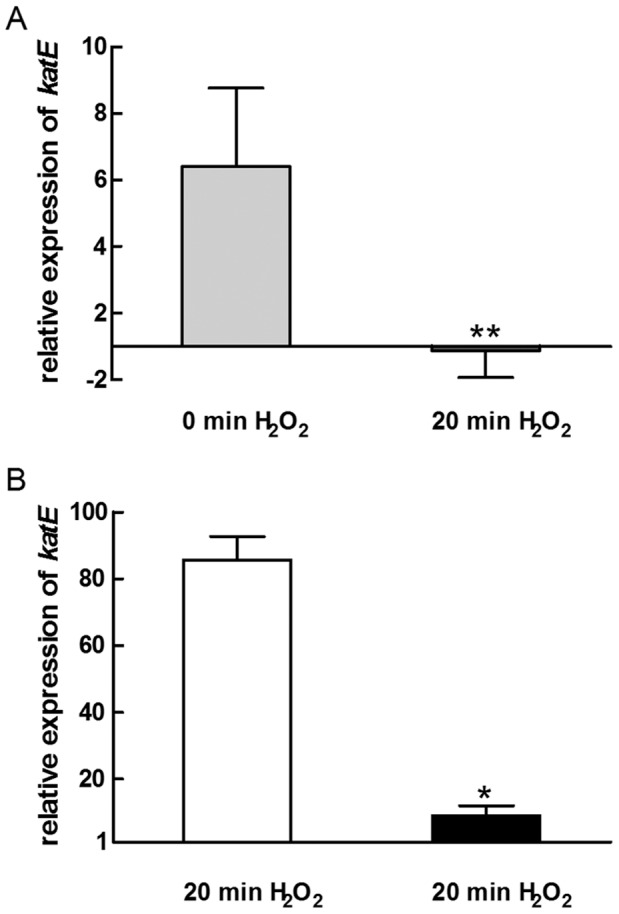
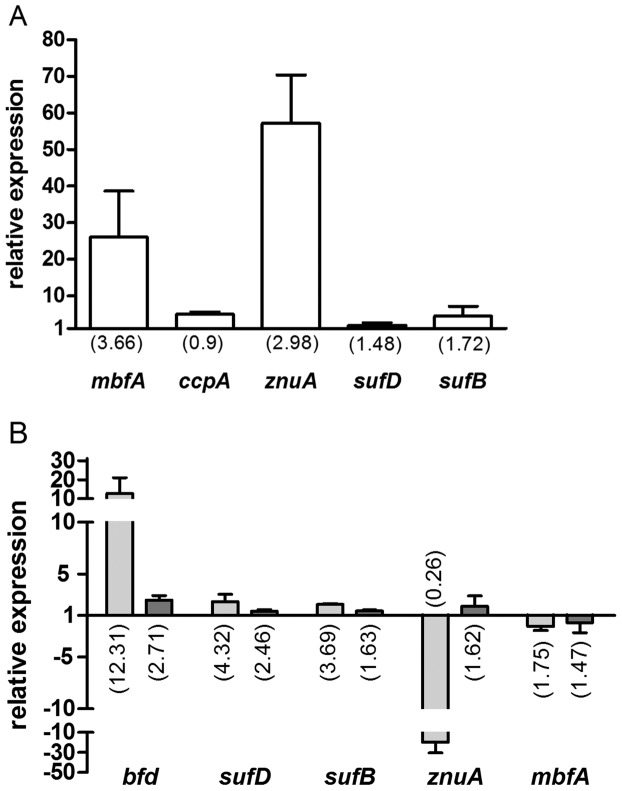
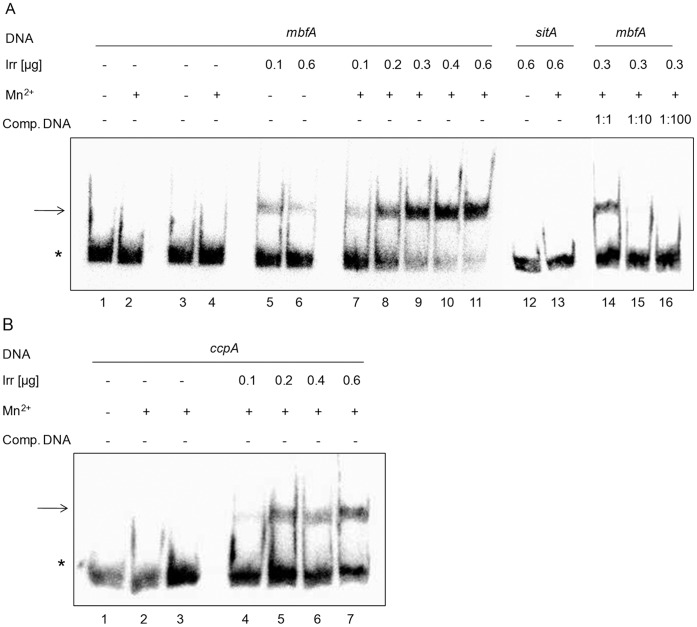
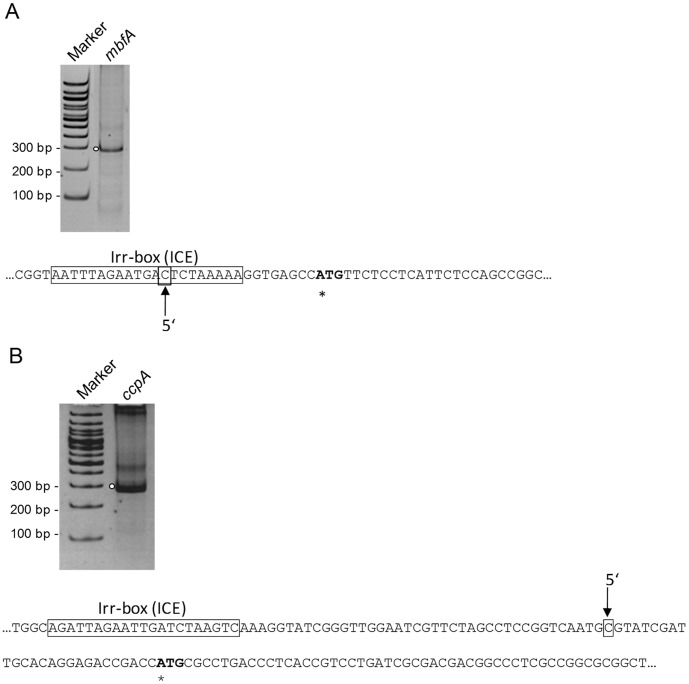
In Rhizobia the Irr protein is an important regulator for iron-dependent gene expression. We studied the role of the Irr homolog RSP_3179 in the photosynthetic alpha-proteobacterium Rhodobacter sphaeroides. While Irr had little effect on growth under iron-limiting or non-limiting conditions its deletion resulted in increased resistance to hydrogen peroxide and singlet oxygen. This correlates with an elevated expression of katE for catalase in the Irr mutant compared to the wild type under non-stress conditions. Transcriptome studies revealed that Irr affects the expression of genes for iron metabolism, but also has some influence on genes involved in stress response, citric acid cycle, oxidative phosphorylation, transport, and photosynthesis. Most genes showed higher expression levels in the wild type than in the mutant under normal growth conditions indicating an activator function of Irr. Irr was however not required to activate genes of the iron metabolism in response to iron limitation, which showed even stronger induction in the absence of Irr. This was also true for genes mbfA and ccpA, which were verified as direct targets for Irr. Our results suggest that in R. sphaeroides Irr diminishes the strong induction of genes for iron metabolism under iron starvation.
Conflict of interest statement
Figures
Similar articles
-
IscR of Rhodobacter sphaeroides functions as repressor of genes for iron-sulfur metabolism and represents a new type of iron-sulfur-binding protein.Microbiologyopen. 2015 Oct;4(5):790-802. doi: 10.1002/mbo3.279. Epub 2015 Aug 1. Microbiologyopen. 2015. PMID: 26235649 Free PMC article.
-
Role of oxygen and the OxyR protein in the response to iron limitation in Rhodobacter sphaeroides.BMC Genomics. 2014 Sep 15;15(1):794. doi: 10.1186/1471-2164-15-794. BMC Genomics. 2014. PMID: 25220182 Free PMC article.
-
The sRNA SorY confers resistance during photooxidative stress by affecting a metabolite transporter in Rhodobacter sphaeroides.RNA Biol. 2015;12(5):569-77. doi: 10.1080/15476286.2015.1031948. RNA Biol. 2015. PMID: 25833751 Free PMC article.
-
The PhyR homolog RSP_1274 of Rhodobacter sphaeroides is involved in defense of membrane stress and has a moderate effect on RpoE (RSP_1092) activity.BMC Microbiol. 2018 Feb 27;18(1):18. doi: 10.1186/s12866-018-1161-4. BMC Microbiol. 2018. PMID: 29486719 Free PMC article.
-
Transcriptome and physiological responses to hydrogen peroxide of the facultatively phototrophic bacterium Rhodobacter sphaeroides.J Bacteriol. 2005 Nov;187(21):7232-42. doi: 10.1128/JB.187.21.7232-7242.2005. J Bacteriol. 2005. PMID: 16237007 Free PMC article.
Cited by
-
IscR of Rhodobacter sphaeroides functions as repressor of genes for iron-sulfur metabolism and represents a new type of iron-sulfur-binding protein.Microbiologyopen. 2015 Oct;4(5):790-802. doi: 10.1002/mbo3.279. Epub 2015 Aug 1. Microbiologyopen. 2015. PMID: 26235649 Free PMC article.
-
Role of oxygen and the OxyR protein in the response to iron limitation in Rhodobacter sphaeroides.BMC Genomics. 2014 Sep 15;15(1):794. doi: 10.1186/1471-2164-15-794. BMC Genomics. 2014. PMID: 25220182 Free PMC article.
-
A Complex Network of Sigma Factors and sRNA StsR Regulates Stress Responses in R. sphaeroides.Int J Mol Sci. 2021 Jul 14;22(14):7557. doi: 10.3390/ijms22147557. Int J Mol Sci. 2021. PMID: 34299177 Free PMC article.
-
The Regulatory Functions of the Multiple Alternative Sigma Factors RpoE, RpoHI, and RpoHII Depend on the Growth Phase in Rhodobacter sphaeroides.Microorganisms. 2023 Oct 31;11(11):2678. doi: 10.3390/microorganisms11112678. Microorganisms. 2023. PMID: 38004690 Free PMC article.
-
The Response Regulator RegA Is a Copper Binding Protein That Covalently Dimerizes When Exposed to Oxygen.Microorganisms. 2022 Apr 29;10(5):934. doi: 10.3390/microorganisms10050934. Microorganisms. 2022. PMID: 35630378 Free PMC article.
References
-
- Hantke K (2001) Iron and metal regulation in bacteria. Curr Opin Microbiol 4: 172–177. - PubMed
-
- Johnston AW, Todd JD, Curson AR, Lei S, Nikolaidou-Katsaridou N, et al. (2007) Living without Fur: the subtlety and complexity of iron-responsive gene regulation in the symbiotic bacterium Rhizobium and other alpha-proteobacteria. Biometals 20: 501–511. - PubMed
-
- Giel JL, Rodionov D, Liu M, Blattner FR, Kiley PJ (2006) IscR-dependent gene expression links iron-sulphur cluster assembly to the control of O2-regulated genes in Escherichia coli . Mol Microbiol 60: 1058–1075. - PubMed
Publication types
MeSH terms
Substances
Associated data
- Actions
LinkOut - more resources
Full Text Sources
Medical
Molecular Biology Databases
