. 2012;7(8):e42331.
doi: 10.1371/journal.pone.0042331. Epub 2012 Aug 3.

Differences in neural-immune gene expression response in rat spinal dorsal horn correlates with variations in electroacupuncture analgesia

Affiliations

Differences in neural-immune gene expression response in rat spinal dorsal horn correlates with variations in electroacupuncture analgesia

Ke Wang et al. PLoS One. 2012.

Abstract

Background: Electroacupuncture (EA) has been widely used to alleviate diverse pains. Accumulated clinical experiences and experimental observations indicated that significant differences exist in sensitivity to EA analgesia for individuals of patients and model animals. However, the molecular mechanism accounting for this difference remains obscure.

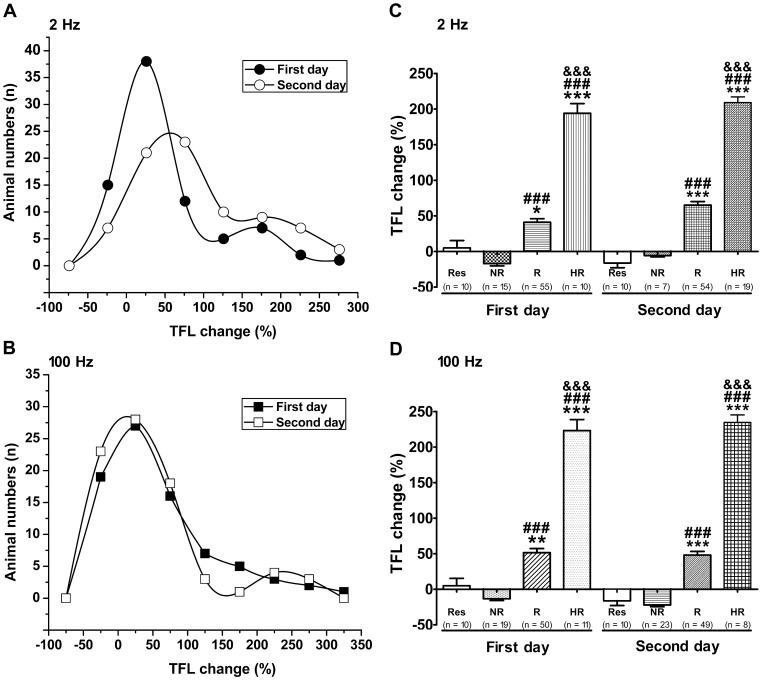
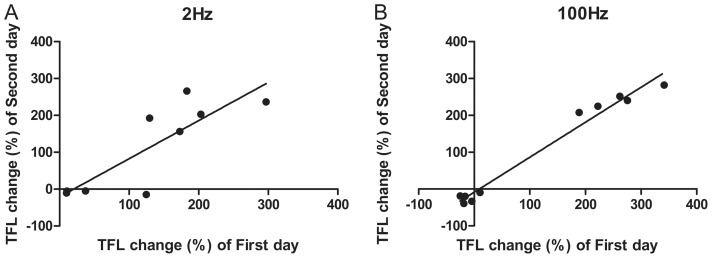
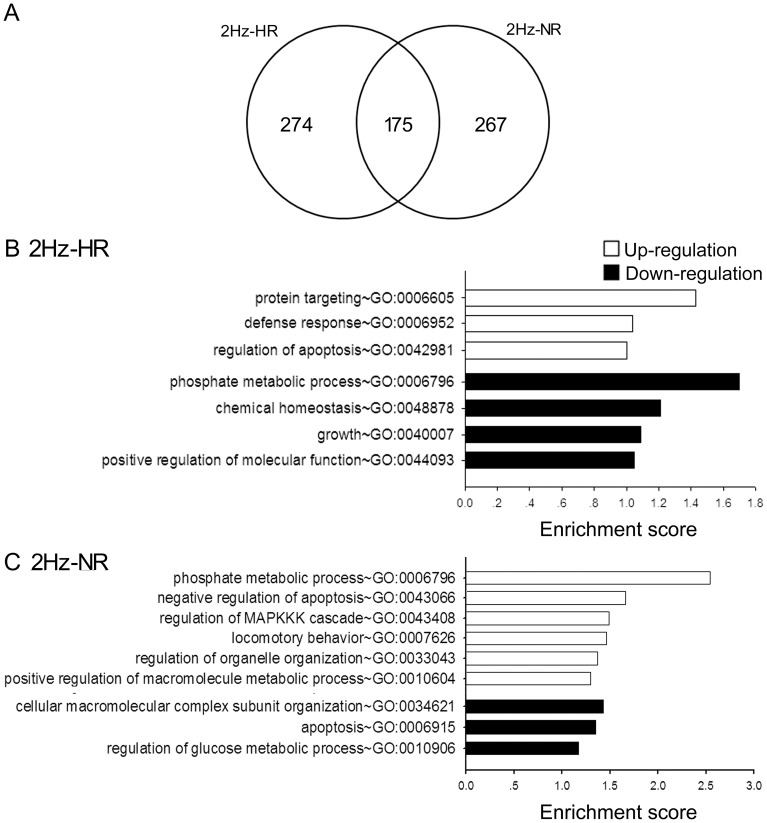
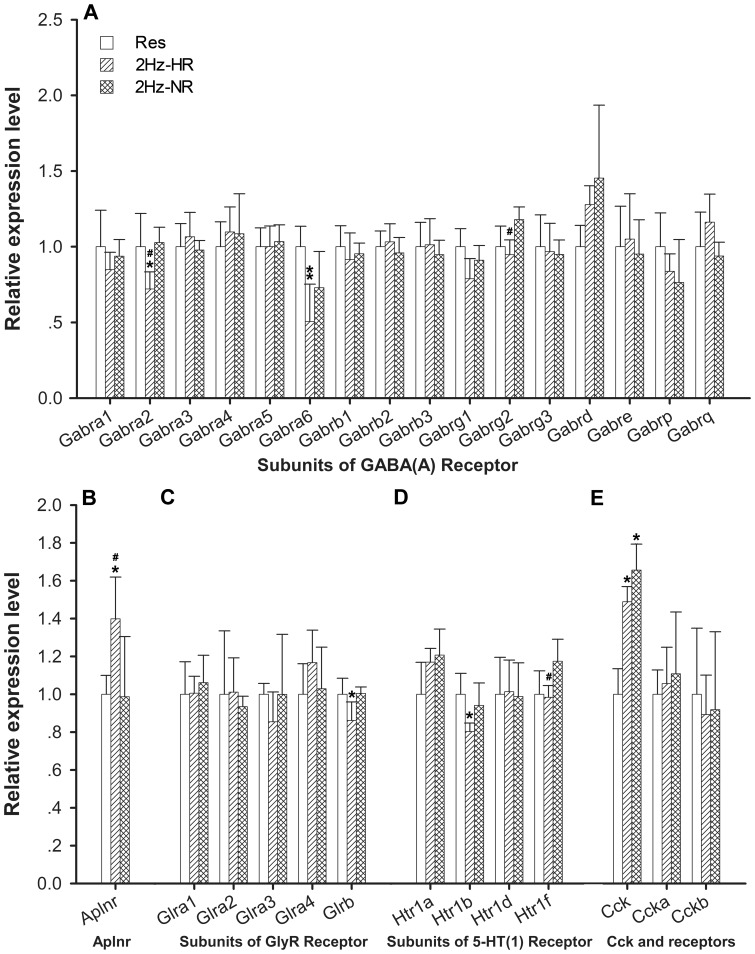
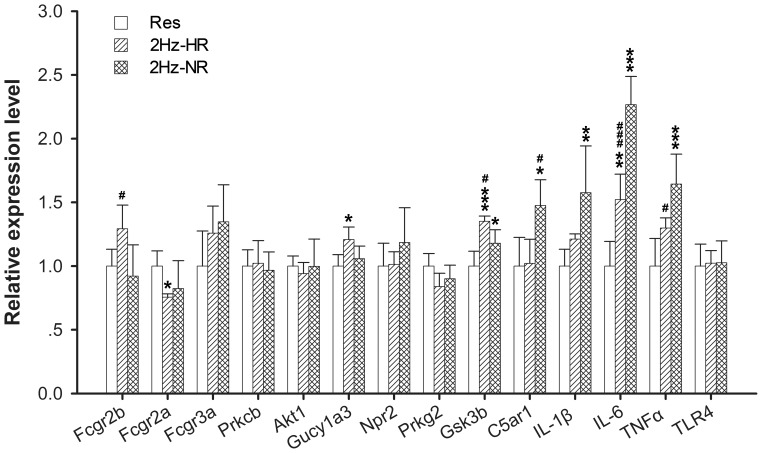
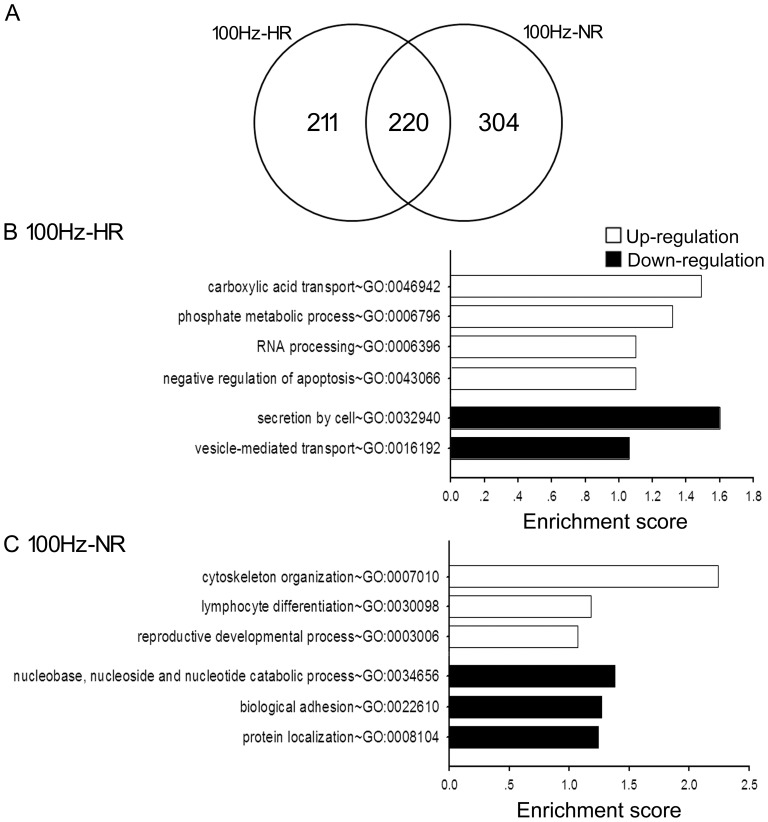
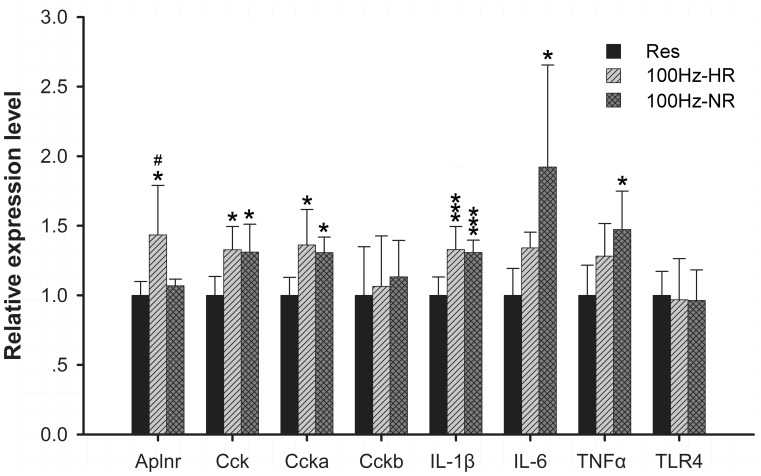
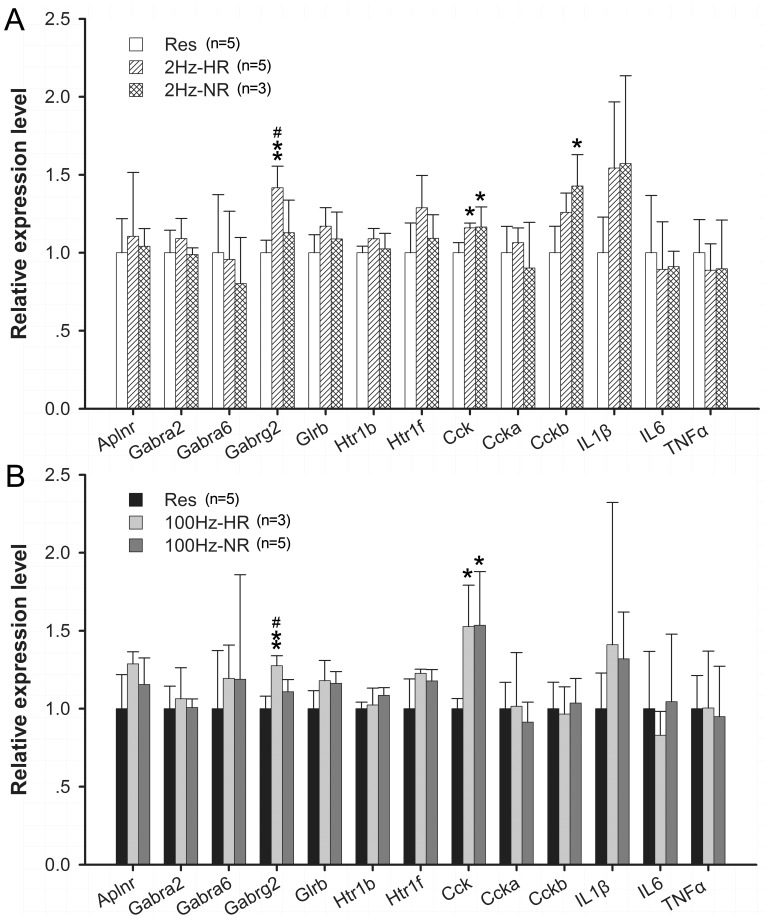
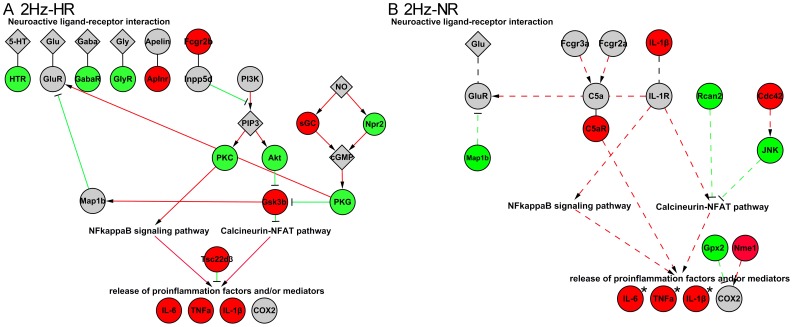
Methodology/principal findings: We classified model male rats into high-responder (HR; TFL changes >150) and non-responder (NR; TFL changes ≤ 0) groups based on changes of their pain threshold detected by tail-flick latency (TFL) before and after 2 Hz or 100 Hz EA treatment. Gene expression analysis of spinal dorsal horn (DH) revealed divergent expression in HR and NR after 2 Hz/100 Hz EA. The expression of the neurotransmitter system related genes was significantly highly regulated in the HR animals while the proinflammation cytokines related genes were up-regulated more significantly in NR than that in HR after 2 Hz and 100 Hz EA stimulation, especially in the case of 2 Hz stimulation.

Conclusions/significance: Our results suggested that differential regulation and coordination of neural-immune related genes might play an important role for individual variations in analgesic effects responding to EA in DH. It also provided new candidate genes related to EA responsiveness for future investigation.


Conflict of interest statement

Competing Interests: The authors have declared that no competing interests exist.

Figures

Figure 1
Figure 1. Analgesic effect induced by 2 Hz and 100 Hz EA in rats.
The analgesic effects of EA on acute thermal pain were quantified using the TFL test, and they are expressed as percent changes from basal TFL. Either 2 Hz (A) or 100 Hz (B) EA, rats showed individual differences in sensitivity of EA analgesia for two consecutive days. A majority of rats showed sensitivity to EA analgesia (TFL change >0) and a small part appeared in contrary way (TFL change ≤0). Plan C and D showed comparison of the EA analgesic effects among the high-responder (HR), responder (R), and non-responder (NR) or restraint (Res) group in two consecutive days. Data are represented as mean ± SEM. One way ANOVA and Bonferroni’s Multiple Comparison Test was used to analysis TFL change (%). *P<0.05, **P<0.01, ***P<0.001 vs. restraint group; ### P<0.001, vs. compared with the corresponding NR group; &&& P<0.001, compared with the corresponding R groups.
Figure 2
Figure 2. Scattergram of analgesic effect on two consecutive days of rats chosen in microarray experiment.
In 2 Hz treated groups, the HR and NR rats have well reproducible in analgesic effect (R = 0.838, P<0.01 Pearson Correlation) on two consecutive days were chosen (A). Meanwhile, the rats in 100 Hz treated groups have well reproducible in analgesic effect (R = 0.988, P<0.001 Pearson Correlation) on two consecutive days were chosen (B).
Figure 3
Figure 3. Overlapped and non-overlapped gene expression and enriched GO categories in 2 Hz-HR and NR rats.
A: Venn diagram comparing the number of genes/ESTs identified as differentially expressed in HR and NR after 2 Hz EA stimulation at 1 hr time point. B and C: Enriched GO categories of specially regulated genes in 2 Hz-HR and 2 Hz-NR. The complete gene list of each GO category is accessible at: Table S3A.
Figure 4
Figure 4. Expression of neurotransmitter receptors-related genes at 1 h.
Data (mean ± SD) are normalized to restraint group. qPCR was conducted with triplicate experiments in each. One way ANOVA and Tukey’s HSD post-hoc test was used. *P<0.05, **P<0.01 vs. restraint group; # P<0.05 vs. NR group.
Figure 5
Figure 5. Expression of release of proinflammatory cytokines-related genes at 1 h.
Data (mean ± SD) are normalized to restraint group. qPCR was conducted with triplicate experiments in each. One way ANOVA and Tukey’s HSD post-hoc test was used. *P<0.05, **P<0.01, ***P<0.001 vs. restraint group; # P<0.05, ### P<0.001 vs. NR group.
Figure 6
Figure 6. Overlapped and non-overlapped gene expression and enriched GO categories in 100 Hz-HR and NR rats.
A: Venn diagram comparing the number of genes/ESTs identified as differentially expressed in HR and NR after 100 Hz EA stimulation at 1 hr time point. B and C: Enriched GO categories of specially regulated genes in 100 Hz-HR and 100 Hz-NR. The complete gene list of each GO category is accessible at Table S5A.
Figure 7
Figure 7. Gene expression detected in 100 Hz-HR and NR at 1 h by qPCR.
Data (mean ± SD) are normalized to restraint group. qPCR was conducted with triplicate experiments in each. One way ANOVA and Tukey’s HSD post-hoc test was used. *P<0.05, **P<0.01 vs. restraint group; # P<0.05 vs. NR group.
Figure 8
Figure 8. Gene expression at 24 hr time point after EA stimulation.
Data (mean ± SD) are normalized to restraint group. qPCR was conducted with triplicate experiments in each. One way ANOVA and Tukey’s HSD post-hoc test was used.
Figure 9
Figure 9. Ideogram illustration depicting the different regulated genes in neural-immune system in HR and NR after 2 Hz EA.
Regulated gene network in the DH at 1 hr time point after 2 Hz EA of 2 Hz-HR group (A) and 2 Hz-NR group (B). The expressions of neurotransmitter receptors were regulated in HR, not in NR. Regulated genes related with the release of proinflammatory cytokines were also shown. The mRNA levels of IL-1β, IL-6, and TNFα were increased in both HR and NR, but higher increased in NR compared with HR. Edges (lines) connecting nodes (genes) represent regulatory interactions such as inhibits (T shape) or activates (Arrow shape). Red node indicates gene up-regulation. Conversely, blue node indicates down-regulation, grey node was non-regulation.

Similar articles

Cited by

References

    1. NIH Consensus Conference. Acupuncture. JAMA 280: 1518–1524. - PubMed
    1. Ulett GA, Han S, Han JS (1998) Electroacupuncture: mechanisms and clinical application. Biol Psychiatry 44: 129–138. - PubMed
    1. Han JS (2011) Acupuncture analgesia: areas of consensus and controversy. Pain 152: S41–48. - PubMed
    1. Zhao ZQ (2008) Neural mechanism underlying acupuncture analgesia. Prog Neurobiol 85: 355–375. - PubMed
    1. Sun J, Qin W, Dong M, Yuan K, Liu J, et al. (2010) Evaluation of group homogeneity during acupuncture stimulation in fMRI studies. J Magn Reson Imaging 32: 298–305. - PubMed

Publication types

MeSH terms