. 2012;7(8):e42336.
doi: 10.1371/journal.pone.0042336. Epub 2012 Aug 7.

Relating the disease mutation spectrum to the evolution of the cystic fibrosis transmembrane conductance regulator (CFTR)

Affiliations

Relating the disease mutation spectrum to the evolution of the cystic fibrosis transmembrane conductance regulator (CFTR)

Lavanya Rishishwar et al. PLoS One. 2012.

Abstract

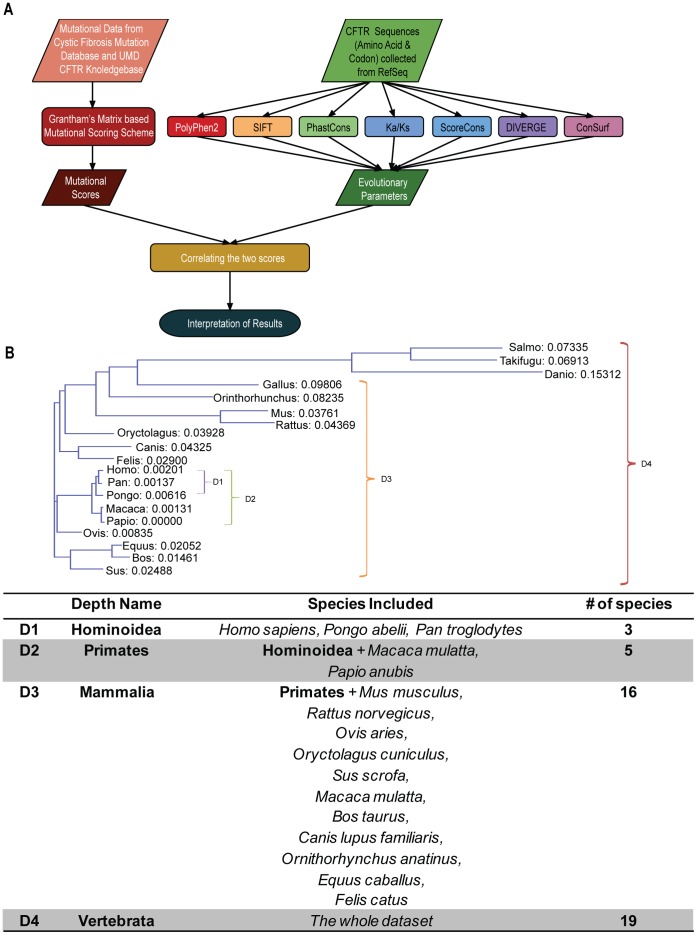
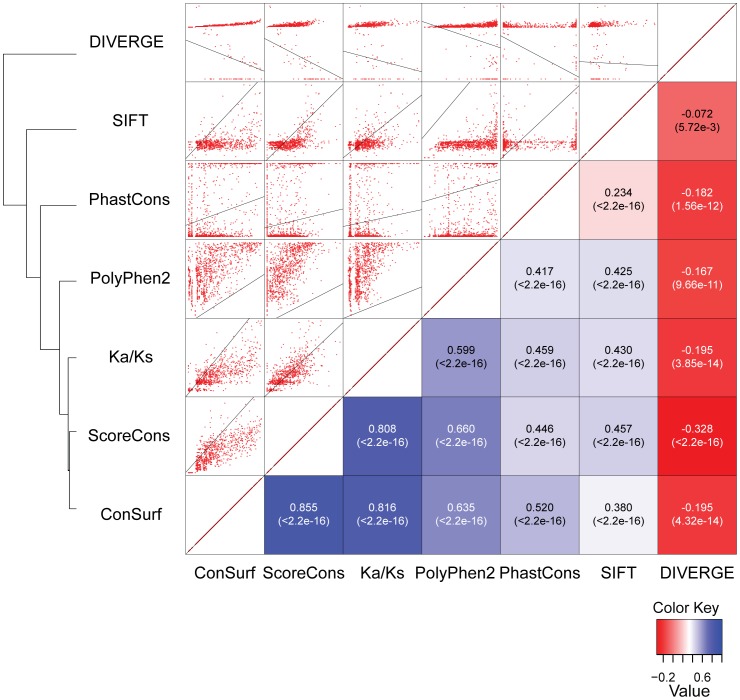
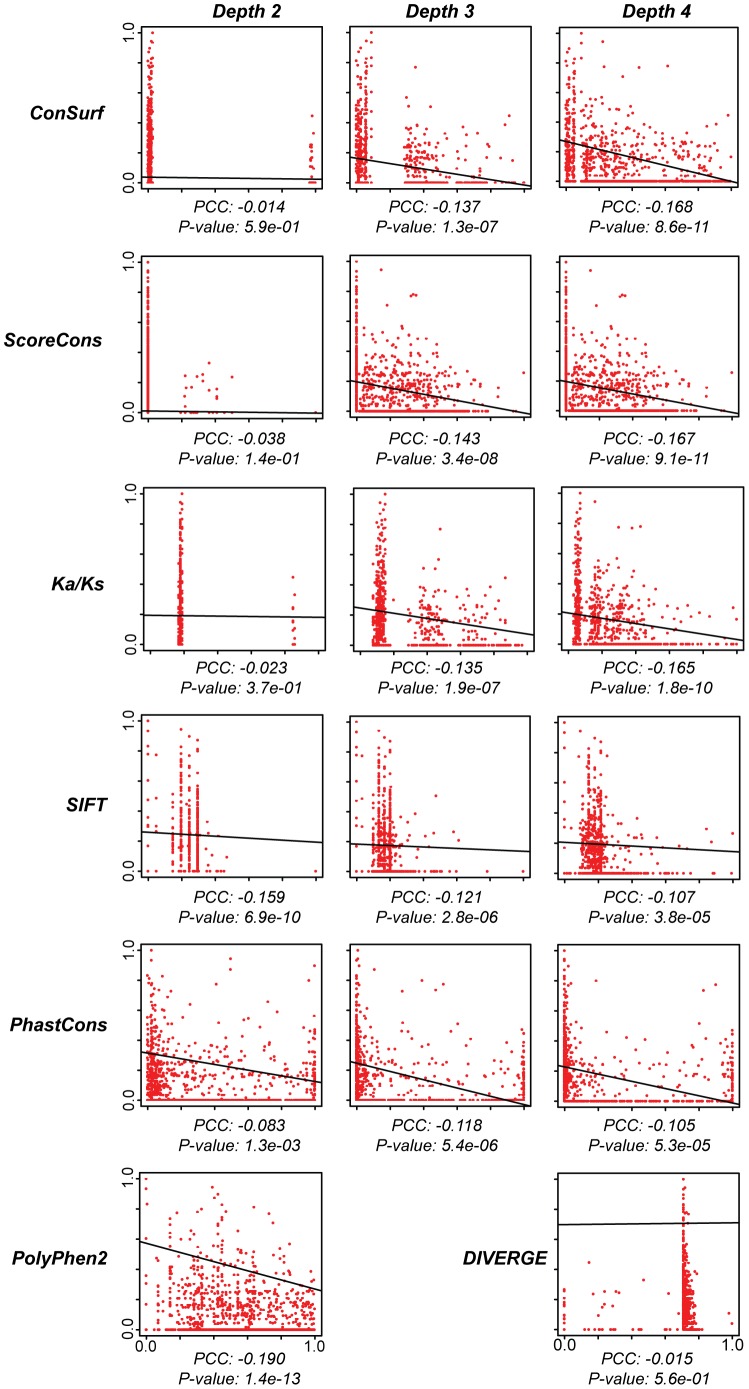
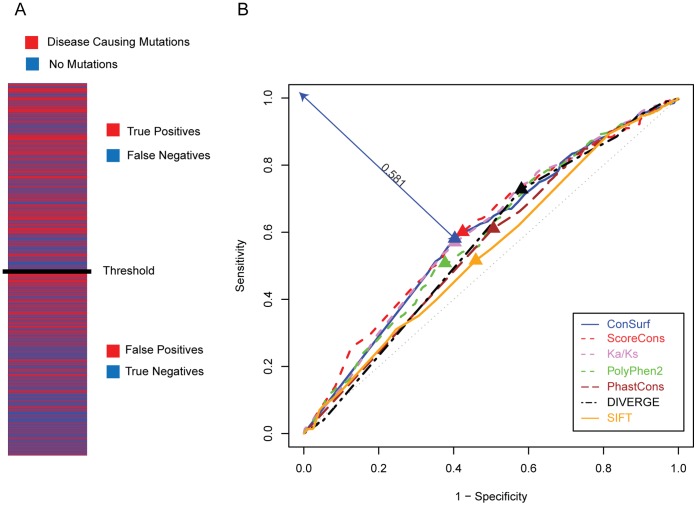
Cystic fibrosis (CF) is the most common genetic disease among Caucasians, and accordingly the cystic fibrosis transmembrane conductance regulator (CFTR) protein has perhaps the best characterized disease mutation spectrum with more than 1,500 causative mutations having been identified. In this study, we took advantage of that wealth of mutational information in an effort to relate site-specific evolutionary parameters with the propensity and severity of CFTR disease-causing mutations. To do this, we devised a scoring scheme for known CFTR disease-causing mutations based on the Grantham amino acid chemical difference matrix. CFTR site-specific evolutionary constraint values were then computed for seven different evolutionary metrics across a range of increasing evolutionary depths. The CFTR mutational scores and the various site-specific evolutionary constraint values were compared in order to evaluate which evolutionary measures best reflect the disease-causing mutation spectrum. Site-specific evolutionary constraint values from the widely used comparative method PolyPhen2 show the best correlation with the CFTR mutation score spectrum, whereas more straightforward conservation based measures (ConSurf and ScoreCons) show the greatest ability to predict individual CFTR disease-causing mutations. While far greater than could be expected by chance alone, the fraction of the variability in mutation scores explained by the PolyPhen2 metric (3.6%), along with the best set of paired sensitivity (58%) and specificity (60%) values for the prediction of disease-causing residues, were marginal. These data indicate that evolutionary constraint levels are informative but far from determinant with respect to disease-causing mutations in CFTR. Nevertheless, this work shows that, when combined with additional lines of evidence, information on site-specific evolutionary conservation can and should be used to guide site-directed mutagenesis experiments by more narrowly defining the set of target residues, resulting in a potential savings of both time and money.


Conflict of interest statement

Competing Interests: The authors have declared that no competing interests exist.

Figures

Figure 1
Figure 1. Scheme of the analysis used in this study.
(A) Flow chart illustrating the joint analysis of CFTR mutation data from the Cystic Fibrosis Mutation Database and site-specific evolutionary metrics based on seven different comparative methods. (B) CFTR phylogenetic tree and associated list of species analyzed indicating the four ascending evolutionary depths used in the study.
Figure 2
Figure 2. Locations of disease-causing mutations along the CFTR protein sequence.
The domain architecture of CFTR is shown with TMD-transmembrane domain, NBD-nucleotide binding domain and R-regulatory domain. The locations of protein residues that are known to be mutated in CF disease cases are indicated with gray vertical bars below the domain architecture, and the average numbers of mutated residues are shown for 10-residue long sliding windows along the length of the protein.
Figure 3
Figure 3. Correlation between evolutionary and mutational scores for individual CFTR domains.
The average ScoreCons per-site score for each of the five CFTR domains was regressed against the average mutational per-site score for the domains.
Figure 4
Figure 4. Probability distributions of the CFTR per-site mutational and evolutionary scores.
For the mutational score (A) and each of the seven evolutionary scores (BH), observed distributions are shown in gray (20 bins) and red (smoothed distributions). The best fitting theoretical distributions are shown in green.
Figure 5
Figure 5. Pairwise correlations between per-site scores and relationships for the seven evolutionary metrics.
Individual per-site CFTR scores were regressed for all pairs of methods. Scatter plots are shown about the diagonal and Pearson correlation coefficients (PCC), along with their associated P-values, shown below the diagonal. The evolutionary metrics are related using hierarchical clustering of the PCC values.
Figure 6
Figure 6. Pairwise correlations between CFTR mutational scores and scores from seven evolutionary metrics.
Mutational scores were regressed against the various evolutionary scores and the resulting Pearson correlation coefficients (PCC) and P-values are shown. The results for all evolutionary metrics, except for PolyPhen2 and DIVERGE, are shown for evolutionary depths 2–4. PolyPhen2 employs an intrinsic similarity search to achieve maximum evolutionary depth, and DIVERGE could only be run at depth 4 (see Table 2).
Figure 7
Figure 7. Predictive power for the seven evolutionary metric scores.
(A) Scheme of the prediction power analysis. Residues mutated in CFTR disease cases are shown in red and non-mutated residues are shown in blue. Residues are ranked in descending order according to an evolutionary conservation metric. A conservation score threshold is chosen; residues above this threshold are predicted to be mutated and those below are predicted to be non-mutated. This allows for the classification of each residue as a true positive, false negative, false positive or true negative according to its classification and its location above or below the score threshold. (B) Receiver operating curve (ROC) analysis was used to evaluate the predictive power of the seven evolutionary metric scores and to maximize the trade-off between sensitivity and specificity. For each evolutionary metric, the point along the ROC curve that minimizes the Euclidean distance between the coordinates y = observed sensitivity, x = observed 1-specificity and the perfect predictor coordinate of y = 1, x = 0 is taken as the optimal threshold (indicated with triangles). An example of the minimal Euclidean distance for the ConSurf method is shown. For the thresholds chosen in that way, sensitivity and specificity are averaged to come up with a ranked predictor value for each evolutionary metric.

Similar articles

Cited by

References

    1. Riordan JR, Rommens JM, Kerem B, Alon N, Rozmahel R, et al. (1989) Identification of the cystic fibrosis gene: cloning and characterization of complementary DNA. Science 245: 1066–1073. - PubMed
    1. Zieve D, Hadjiliadis D (2011) Cystic Fibrosis. Available: http://www.ncbi.nlm.nih.gov/pubmedhealth/PMH0001167/. Accessed 2012 Mar 30..
    1. Adzhubei IA, Schmidt S, Peshkin L, Ramensky VE, Gerasimova A, et al. (2010) A method and server for predicting damaging missense mutations. Nat Methods 7: 248–249. - PMC - PubMed
    1. Gaucher EA, De Kee DW, Benner SA (2006) Application of DETECTER, an evolutionary genomic tool to analyze genetic variation, to the cystic fibrosis gene family. BMC Genomics 7: 44. - PMC - PubMed
    1. Ng PC, Henikoff S (2003) SIFT: Predicting amino acid changes that affect protein function. Nucleic Acids Res 31: 3812–3814. - PMC - PubMed

Publication types

MeSH terms

Substances