

Association of OPA1 polymorphisms with NTG and HTG: a meta-analysis
- PMID: 22879959
- PMCID: PMC3411762
- DOI: 10.1371/journal.pone.0042387
Association of OPA1 polymorphisms with NTG and HTG: a meta-analysis
Abstract
Background: Genetic polymorphisms of the Optic atrophy 1 gene have been implicated in altering the risk of primary open angle glaucoma (POAG), especially the susceptibility to normal tension glaucoma (NTG), but the results remain controversial.
Methods: Multiple electronic databases (up to January 20, 2012) were searched independently by two investigators. A meta-analysis was performed on the association between Optic atrophy 1 polymorphisms (rs 166850 and rs 10451941) and normal tension glaucoma (NTG)/high tension glaucoma (HTG). Summary odds ratios (ORs) and 95% confidence intervals (CI) were estimated.
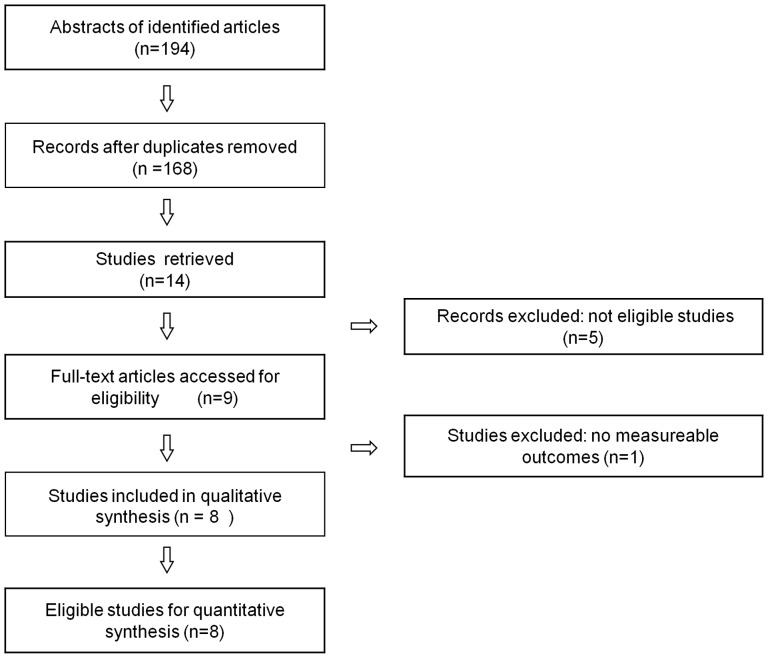
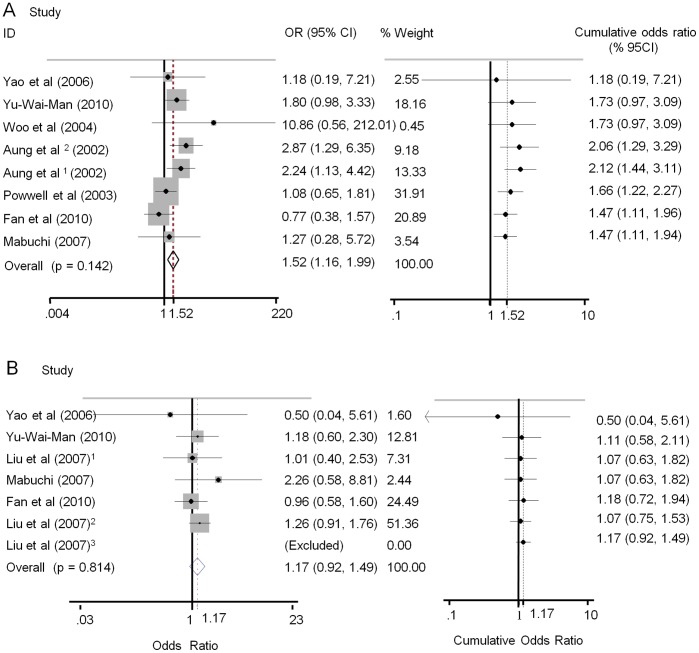
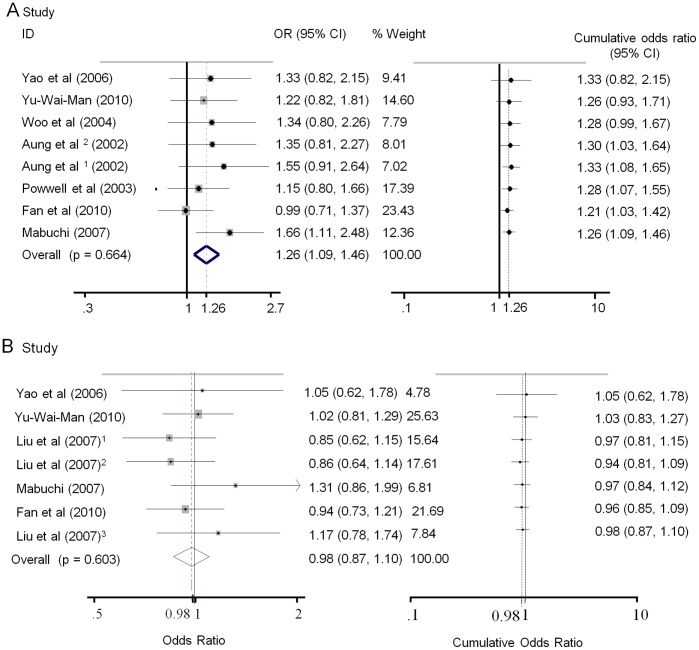
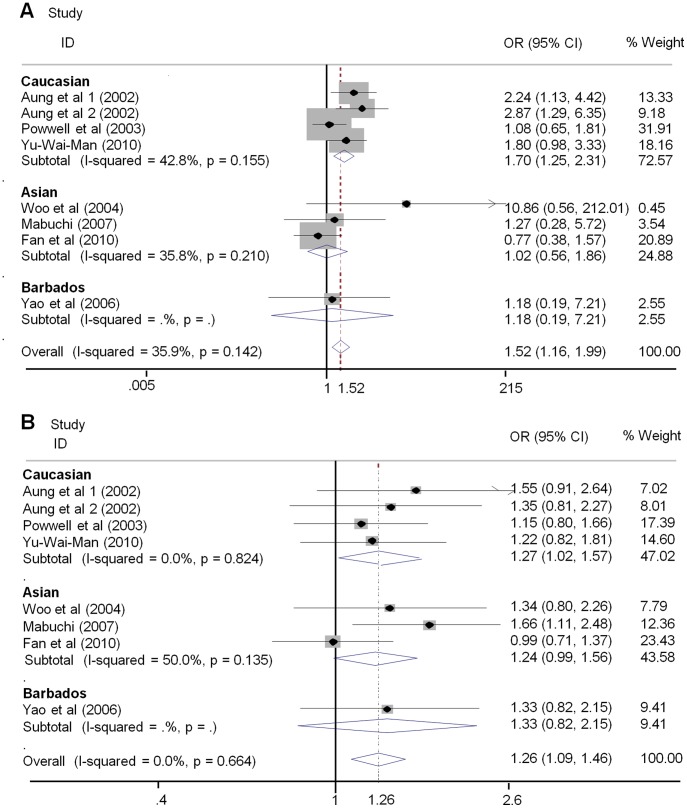
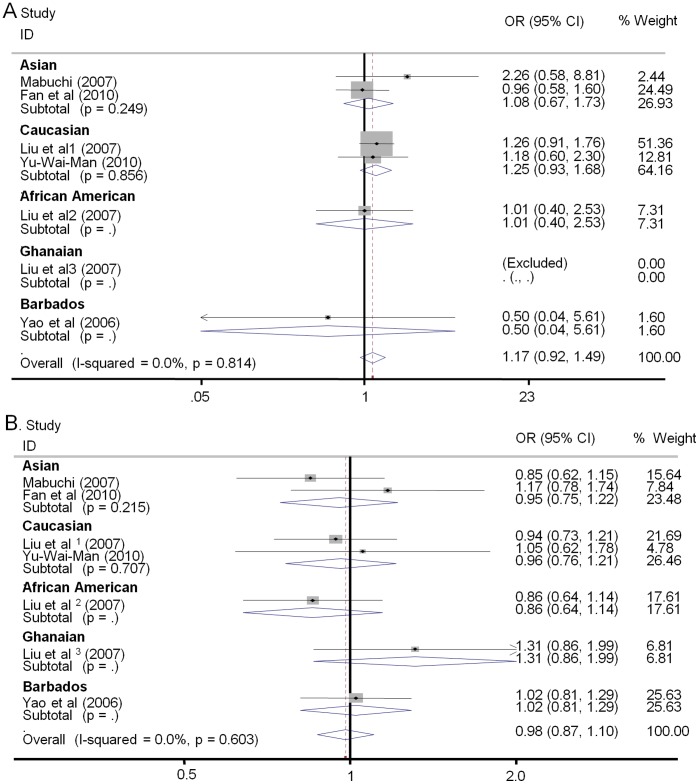
Results: Seven studies of 713 cases and 964 controls for NTG and five studies of 1200 cases and 971 controls for HTG on IVS8+4C>T (rs 166850) and IVS8+32T>C (rs10451941) were identified. There were significant associations between the OPA1 rs10451941polymorphism and NTG susceptibility for all genetic models(C vs. T OR = 1.26, 95% CI 1.09-1.47, p = 0.002; CC vs. TT: OR = 1.52, 95% CI 1.04-2.20, p = 0.029; CC vs. CT+TT: OR = 1.64, 95% CI 1.16-2.33, p = 0.005; CC+CT vs. TT: OR = 1.21, 95% CI 1.02-1.44, p = 0.032). However, no evidence of associations was detected between the OPA1 IVS8+32C>T polymorphism and POAG susceptibility to HTG. Similarly, clear associations between the rs 166850 variant and NTG were observed in allelic and dominant models (T vs. C OR = 1.52, 95% CI 1.16-1.99, p = 0.002; TT+TC vs. CC OR = 1.50, 95% CI 1.13-2.01, p = 0.006) but not to HTG. In subgroup analyses by ethnicity, we detected an association between both OPA1 polymorphisms and risk for NTG in Caucasians but not in Asians. By contrast, no significant findings were noted between OPA1 variants for HTG, either in Caucasians or in Asians.
Conclusions: Both the IVS8+4C>T and IVS8+32T>C variants may affect individual susceptibility to NTG. Moreover, stratified analyses for NTG detecting the effects of both OPA1 polymorphisms seemed to vary with ethnicity. Further investigations are needed to validate the association.
Conflict of interest statement
Figures
References
-
- Coleman AL, Brigatti L (2001) The glaucomas. Minerva Med 92: 365–379. - PubMed
-
- Cedrone C, Mancino R, Cerulli A, Cesareo M, Nucci C (2008) Epidemiology of primary glaucoma: prevalence, incidence, and blinding effects. Prog Brain Res 173: 3–14. - PubMed
-
- Wen W, Sun XH (2010) Primary glaucoma and psychological characteristics]. Zhonghua Yan Ke Za Zhi 46: 566–571. - PubMed
-
- Kim E, Varma R (2010) Glaucoma in Latinos/Hispanics. Curr Opin Ophthalmol 21: 100–105. - PubMed
-
- Foster PJ (2002) The epidemiology of primary angle closure and associated glaucomatous optic neuropathy. Semin Ophthalmol 17: 50–58. - PubMed
Publication types
MeSH terms
Substances
LinkOut - more resources
Full Text Sources
Other Literature Sources
Medical
