. 2012;7(8):e42428.
doi: 10.1371/journal.pone.0042428. Epub 2012 Aug 3.

Heme oxygenase-1 protects retinal endothelial cells against high glucose- and oxidative/nitrosative stress-induced toxicity

Affiliations

Heme oxygenase-1 protects retinal endothelial cells against high glucose- and oxidative/nitrosative stress-induced toxicity

Áurea F Castilho et al. PLoS One. 2012.

Abstract

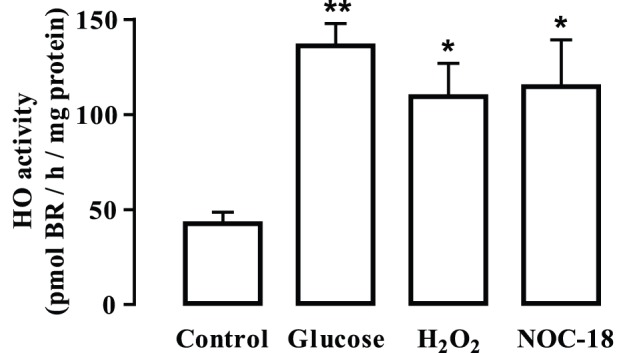
Diabetic retinopathy is a leading cause of visual loss and blindness, characterized by microvascular dysfunction. Hyperglycemia is considered the major pathogenic factor for the development of diabetic retinopathy and is associated with increased oxidative/nitrosative stress in the retina. Since heme oxygenase-1 (HO-1) is an enzyme with antioxidant and protective properties, we investigated the potential protective role of HO-1 in retinal endothelial cells exposed to high glucose and oxidative/nitrosative stress conditions. Retinal endothelial cells were exposed to elevated glucose, nitric oxide (NO) and hydrogen peroxide (H(2)O(2)). Cell viability and apoptosis were assessed by MTT assay, Hoechst staining, TUNEL assay and Annexin V labeling. The production of reactive oxygen species (ROS) was detected by the oxidation of 2',7'-dichlorodihydrofluorescein diacetate. The content of HO-1 was assessed by immunobloting and immunofluorescence. HO activity was determined by bilirubin production. Long-term exposure (7 days) of retinal endothelial cells to elevated glucose decreased cell viability and had no effect on HO-1 content. However, a short-time exposure (24 h) to elevated glucose did not alter cell viability, but increased both the levels of intracellular ROS and HO-1 content. Moreover, the inhibition of HO with SnPPIX unmasked the toxic effect of high glucose and revealed the protection conferred by HO-1. Oxidative/nitrosative stress conditions increased cell death and HO-1 protein levels. These effects of elevated glucose and HO inhibition on cell death were confirmed in primary endothelial cells (HUVECs). When cells were exposed to oxidative/nitrosative stress conditions there was also an increase in retinal endothelial cell death and HO-1 content. The inhibition of HO enhanced ROS production and the toxic effect induced by exposure to H(2)O(2) and NOC-18 (NO donor). Overexpression of HO-1 prevented the toxic effect induced by H(2)O(2) and NOC-18. In conclusion, HO-1 exerts a protective effect in retinal endothelial cells exposed to hyperglycemic and oxidative/nitrosative stress conditions.


Conflict of interest statement

Competing Interests: The authors have declared that no competing interests exist.

Figures

Figure 1
Figure 1. Long-term exposure to high glucose decreases the viability of retinal endothelial cells and does not change HO-1 protein levels.
Cells were exposed to 30 mM glucose or mannitol (24.5 mM+5.5 mM glucose; osmotic control) for 7 days. Cell viability was assessed by the MTT reduction assay (A). HO-1 immunoreactivity was analysed by Western blotting (B) and by immunocytochemistry (C). In (B), representative Western blots for HO-1 are presented above the graph. The intensity of the bands was determined by quantitative densitometric analysis. In (C), the representative images were acquired in a confocal microscope (600x magnification). The results represent the mean ± SEM of at least six independent experiments, performed in triplicate in the case of the MTT assay, and are expressed as percentage of control. **p<0.01; significantly different from control as determined by one-way ANOVA followed by Dunnett’s post test.
Figure 2
Figure 2. Exposure of retinal endothelial cells to stress conditions decreases cell viability and increases intracellular ROS production.
Cells were exposed to 30 mM glucose, mannitol (24.5 mM+5.5 mM glucose), 100 µM H2O2 or 250 µM NOC-18 for 24 h. Cell viability was assessed by the MTT reduction assay (A). The results represent the mean ± SEM of at least five independent experiments, performed in triplicate, and are expressed as percentage of control. The production of intracellular ROS was assessed by the oxidation of 2′,7′-dichlorodihydrofluorescein diacetate to the fluorescent 2′,7′-dichlorofluorescein. The results represent the mean ± SEM of six independent experiments and are expressed as percentage of control of the ratio arbitrary units/total protein. *p<0.05 and **p<0.01; significantly different from control, as determined by one-way ANOVA followed by Dunnett’s post test.
Figure 3
Figure 3. Exposure to high glucose, H2O2 or NOC-18 increases HO-1 protein levels in retinal endothelial cells.
Cells were exposed to 30 mM glucose (A), mannitol (24.5 mM+5.5 mM glucose) (B), 100 µM H2O2 (C) or 250 µM NOC-18 (D) for 1, 3, 6, 12 or 24 h. HO-1 immunoreactivity was analysed by Western blotting (A-D) and by immunocytochemistry (E). Representative Western blots for HO-1 are presented above the graphs. The intensity of the bands was determined by quantitative densitometric analysis. The images in (E) were acquired in a confocal microscope (600x magnification). The results represent the mean ± SEM of at least three independent experiments, and are expressed as percentage of control. *p<0.05, **p<0.01; significantly different from control as determined by one-way ANOVA followed by Dunnett’s post test.
Figure 4
Figure 4. Exposure to high glucose, H2O2 or NOC-18 increases HO-1 activity in retinal endothelial cells.
Cells were exposed to 30 mM glucose, 100 µM H2O2 or 250 µM NOC-18 for 24 h. Enzymatic activity was determined spectrophotometrically, by measuring the formation of bilirubin (BR). Data are presented as mean ± SEM of at least five independent experiments and are expressed as picomol of BR per hour and per mg of total protein. *p<0.05, **p<0.01; significantly different from control as determined by one-way ANOVA followed by Dunnett’s post test.
Figure 5
Figure 5. HO-1 inhibition enhances hyperglycemic toxicity and endothelial cell susceptibility to H2O2 or NOC-18.
Cells were exposed to 30 mM glucose, mannitol (24.5 mM+5.5 mM glucose), 100 µM H2O2 or 250 µM NOC-18 for 24 h, in the absence or in the presence of SnPPIX (10 µM), a HO inhibitor. Cell viability was assessed by the MTT reduction assay (A). The results represent the mean ± SEM of at least four independent experiments, performed in triplicate, and are expressed as percentage of control. Cell death was determined by Hoechst staining. Cells with condensed/fragmented nuclei were considered apoptotic (B). The results represent the mean ± SEM of four independent experiments. *p<0.05, **p<0.01, ***p<0.005; significantly different from control (one-way ANOVA followed by Dunnett’s post test). #p<0.05; significantly different from a similar condition, but in the absence of SnPPIX (one-way ANOVA followed by Bonferronís post test). Apoptotic cells were identified either by TUNEL assay or Annexin V labeling (C–E). The TUNEL staining images were acquired in a confocal microscope (400x magnification, scale bar 20 µm) and show TUNEL staining in green and nuclei staining with DAPI in blue (C). The quantitative results from TUNEL assay represent mean ± SEM of four independent experiments and are presented as percentage of TUNEL-positive cells per field (D). The results from Annexin V labeling represent mean ± SEM of five independent experiments and are presented as Annexin V-positive cells per field (E).
Figure 6
Figure 6. Overexpression of HO-1 protects retinal endothelial cells from the toxic effect of H2O2 and NOC-18.
Cells were transfected with pcDNA3-HO-1 by electroporation. After electroporation, cells were allowed to recover for 24 h and then were exposed to 100 µM H2O2 or 250 µM NOC-18 for 24 h. Representative Western Blot showing an increase in the protein content of HO-1 in transfected cells (A). Enzymatic activity on electroporated cells was determined spectrophotometrically, by measuring the formation of bilirubin (BR). Data are presented as mean ± SEM of five independent experiments and are expressed as pmol of BR per hour and per mg of total protein (B). *p<0.05; significantly different from non-electroporated cells as determined by Student’s t test. Cell death by apoptosis was assessed by Hoechst staining (C, D). The images were acquired in a fluorescence microscope (400x magnification). The results represent the mean ± SEM of at least four independent experiments.

Similar articles

Cited by

References

    1. Cunha-Vaz JG (2000) Diabetic retinopathy: surrogate outcomes for drug development for diabetic retinopathy. Ophthalmologica 214: 377–380. - PubMed
    1. DCCTResearchGroup (1995) The relationship of glycemic exposure (HbA1c) to the risk of development and progression of retinopathy in the diabetes control and complications trial. Diabetes 44: 968–983. - PubMed
    1. Hebert LF, Daniels MC, Zhou J, Crook ED, et al. (1996) Overexpression of Glutamine:Fructose-6-Phosphate Amidotransferase in Transgenic Mice Leads to Insulin Resistance. J Clin Invest 98: 930–936. - PMC - PubMed
    1. Nakamura M, Barber AJ, Antonetti DA, LaNoue KF, Robinson KA, et al. (2001) Excessive hexosamines block the neuroprotective effect of insulin and induce apoptosis in retinal neurons. J Biol Chem 276: 43748–43755. - PubMed
    1. Williamson JR, Chang K, Frangos M, Hasan KS, Ido Y, et al. (1993) Hyperglycemic pseudohypoxia and diabetic complications. Diabetes 42: 801–813. - PubMed

Publication types

MeSH terms