. 2012;7(8):e42452.
doi: 10.1371/journal.pone.0042452. Epub 2012 Aug 3.

Detection of bladder cancer using proteomic profiling of urine sediments

Affiliations

Detection of bladder cancer using proteomic profiling of urine sediments

Tadeusz Majewski et al. PLoS One. 2012.

Abstract

We used protein expression profiles to develop a classification rule for the detection and prognostic assessment of bladder cancer in voided urine samples. Using the Ciphergen PBS II ProteinChip Reader, we analyzed the protein profiles of 18 pairs of samples of bladder tumor and adjacent urothelium tissue, a training set of 85 voided urine samples (32 controls and 53 bladder cancer), and a blinded testing set of 68 voided urine samples (33 controls and 35 bladder cancer). Using t-tests, we identified 473 peaks showing significant differential expression across different categories of paired bladder tumor and adjacent urothelial samples compared to normal urothelium. Then the intensities of those 473 peaks were examined in a training set of voided urine samples. Using this approach, we identified 41 protein peaks that were differentially expressed in both sets of samples. The expression pattern of the 41 protein peaks was used to classify the voided urine samples as malignant or benign. This approach yielded a sensitivity and specificity of 59% and 90%, respectively, on the training set and 80% and 100%, respectively, on the testing set. The proteomic classification rule performed with similar accuracy in low- and high-grade bladder carcinomas. In addition, we used hierarchical clustering with all 473 protein peaks on 65 benign voided urine samples, 88 samples from patients with clinically evident bladder cancer, and 127 samples from patients with a history of bladder cancer to classify the samples into Cluster A or B. The tumors in Cluster B were characterized by clinically aggressive behavior with significantly shorter metastasis-free and disease-specific survival.


Conflict of interest statement

Competing Interests: CC was originally an employee of Ciphergen Biosystems, Inc., Fremont, California at the time of the initial study related to this project. Currently, she is working in the Office of the Vice President for Translational Research at The University of Texas M D Anderson Cancer Center. Her affiliation with Ciphergen does not alter the authors’ adherence to all the PLoS ONE policies on sharing data and materials.

Figures

Figure 1
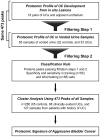
Figure 1. Analytical strategy used to develop classification rule for bladder cancer.
The proteomic profile of bladder cancer development from in situ neoplasia was developed on a collection of proteomic spectra from paired samples of urothelial carcinoma (UC) and adjacent urothelium compared to normal urothelium. Using this approach, 473 protein peaks expressed in normal urothelium were identified. The same 473 were subsequently identified in the training set of voided urine samples from control subjects and patients with UC. The protein peaks first identified as abnormally expressed in tissue samples (filtering step 1) and then in the training set of voided urine samples (filtering step 2) were used to design a classification rule. The performance of the classification rule was assessed first in the training set and then in a blind testing set. Finally, a cluster analysis was performed using 473 protein peaks on all control and UC samples to identify the proteomic signature of aggressive bladder cancer.
Figure 2
Figure 2. Proteomic profile of bladder cancer.
(A) Digitalized proteomic profile of bladder cancer development from in situ neoplasia. Expression levels of protein peaks were analyzed on paired samples from adjacent urothelium (AU) and UCs compared to normal urothelium (NU). Each column represents UC or AU samples and each row corresponds to a digitalized protein peaks arranged according to M/Z ratios. Ratios of individual M/Z peak relative to NU are shown as a color saturation scale below the diagram. Samples corresponding to AU and UC are grouped according to their pathogenetic subsets representing low-grade (Grade 1–2) superficial papillary UC (LGPUC) and high grade (Grade 3) invasive UC (HGNPUC). The bar diagram on the right shows individual protein peaks with higher (red) and lower (blue) expression levels as compared to NU. Column 1: comparison between NU and AU LGPUC, 2: comparison between NU and LGPUC, 3: comparison between NU and AU HGNPUC, 4: comparison between NU and HGNPUC. (B) Proteomic profile of voided urine samples from control subjects (normal control, NC) and patients with UC dichotomized into LGPUC and HGNPUC categories. The bar diagram on the right shows individual protein peaks with higher (red) and lower (blue) expression levels as compared to NU. Column 1: comparison between NC and LGPUC; Column 2: comparison between NC and HGNPUC. (C) Number of protein peaks with higher (maroon) and lower (purple) expression levels as compared to NU identified in paired tissue samples of AU and in voided urine samples of patients with UC compared to NC. (D) Proportion of proteins peaks with similar and dissimilar expression pattern.
Figure 3
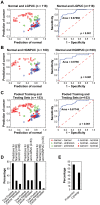
Figure 3. Detection of bladder cancer by proteomic profiling using 41 protein peaks.
(A) Up regulated (red) and down regulated (blue) protein peaks identified in AU and UC (upper row) and voided urine samples (mid row) and the protein peaks consistently found in both sets of samples (lower row). (B) Heat map for 41 protein peaks identified by filtering step 2. (See Figure 1) (C) Classification of individual samples (left panel) and ROC curve (right panel) in the training set. (D) Classification of individual samples (left panel) and ROC curve (right panel) in the testing set.
Figure 4
Figure 4. Detection of bladder cancer by proteomic profiling using 41 protein peaks in LGPUC and HGNPUC.
(A) Classification of individual samples (left panel) and ROC curve (right panel) based on 65 benign control samples and 53 samples from patients with LGPUC. (B) Classificatin of individual samples (left panel) and ROC curve (right panel) based 65 benign control samples 35 samples from patients with HGNPUC. (C) Classification of individual samples (left panel) and ROC curve (right panel) based on 65 benign control samples and 88 samples from patients with UC.(combined training and testing sets) (D) Comparison of diagnostic accuracy of proteomics and cytology on 39 samples from patients with UC. (E) Classification of individual samples by proteomics based on the combined testing and training sets as well as for LGPUC and HGNPUC separately.
Figure 5
Figure 5. Unsupervised hierarchical clustering of voided urine samples (n = 280).
The cohort included 65 normal controls (NC), 88 patients with clinically evident bladder cancer (UC) and 127 patients with a history of bladder cancer (HiUC). Clustering was performed using Euclidean distance and the matrix of expression intensities for 473 protein peaks. Each column represents a voided urine sample and each row corresponds to the digitalized protein peaks arranged according to M/Z ratios.
Figure 6
Figure 6. Distribution of various samples in clusters A and B.
(A) Distribution of voided urine samples in cluster A and B of normal controls (NC), patients with clinically evident bladder cancer (UC) and patients with history of bladder cancer (HiUC). (B) Distribution of voided urine samples in Clusters A and B according to histologic grade and stage dichotomized into low grade invasive superficial papillary UC (LGPUC, pTa – pT1a) and high grade non-papillary UC (HGNPUC, T1b and higher). (C) Kaplan – Mayer plots of metastasis and disease specific survival of patients with bladder cancer in Clusters A and B.
Figure 7
Figure 7. Expression patterns of selected protein peaks with molecular weights corresponding to α-defensins.
(A) Protein profiles between 3300 and 3600 m/z of representative samples corresponding to NC, LGPUC and HGNPUC showing the expression pattern of three protein peaks with 3370, 3440 and 3490±10 m/z referred to as peaks 1–3 (pk 1–3) representing the cluster of α-defensins. (B) Zoomed heat map showing the expression pattern of α-defensin cluster in the training set. (C) The expression intensities of α-defensin cluster corresponding to pk 1–3 in pulled samples of testing and training sets of NC, LGPUC and HGNPUC. Crossed red lines and vertical bars represent mean and standard deviations. Two sample T-test was used to compare the log2-transformed peak intensities in cancer samples and controls for each respective peak (p<0.001).

References

    1. Dinney CP, McConkey DJ, Millikan RE, Wu X, Bar-Eli M, et al. (2004) Focus on bladder cancer. Cancer Cell 6: 111–116. - PubMed
    1. Spiess PE, Czerniak B (2006) Dual-track pathway of bladder carcinogenesis: practical implications. Arch Pathol Lab Med 130: 844–852. - PubMed
    1. Gazdar AF, Czerniak B (2001) Filling the void: urinary markers for bladder cancer risk and diagnosis. J Natl Cancer Inst 93: 413–415. - PubMed
    1. Rogers MA, Clarke P, Noble J, Munro NP, Paul A, et al. (2003) Proteomic profiling of urinary proteins in renal cancer by surface enhanced laser desorption ionization and neural-network analysis: identification of key issues affecting potential clinical utility. Cancer Res 63: 6971–6983. - PubMed
    1. Schaub S, Wilkins J, Weiler T, Sangster K, Rush D, et al. (2004) Urine protein profiling with surface-enhanced laser-desorption/ionization time-of-flight mass spectrometry. Kidney Int 65: 323–332. - PubMed

Publication types