. 2012;7(8):e42456.
doi: 10.1371/journal.pone.0042456. Epub 2012 Aug 3.

FOXA1 promotes tumor progression in prostate cancer via the insulin-like growth factor binding protein 3 pathway

Affiliations

FOXA1 promotes tumor progression in prostate cancer via the insulin-like growth factor binding protein 3 pathway

Yusuke Imamura et al. PLoS One. 2012.

Abstract

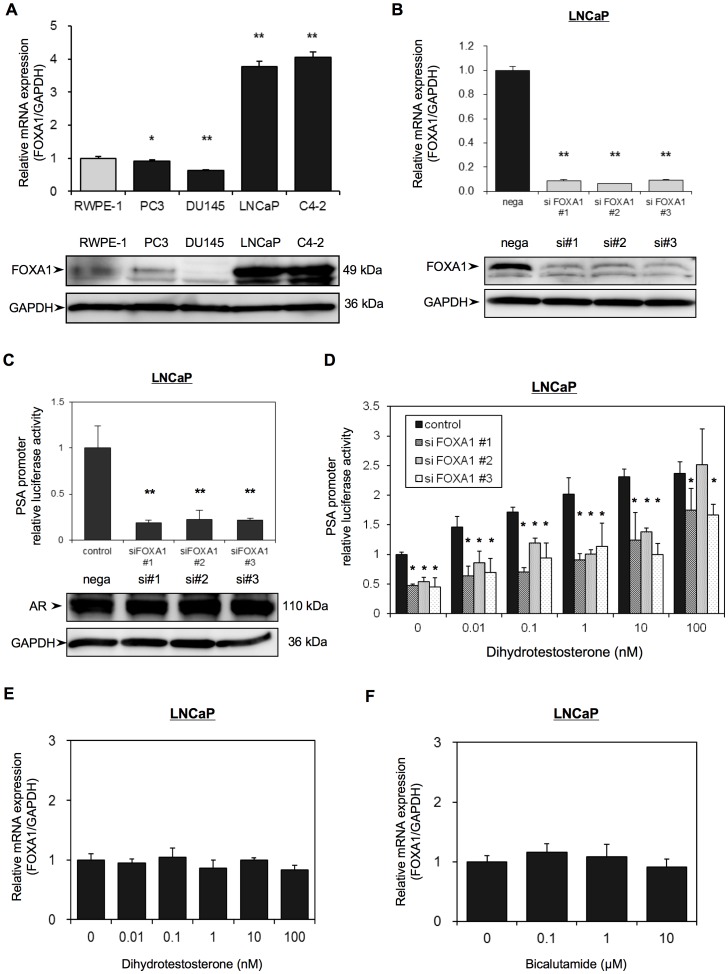
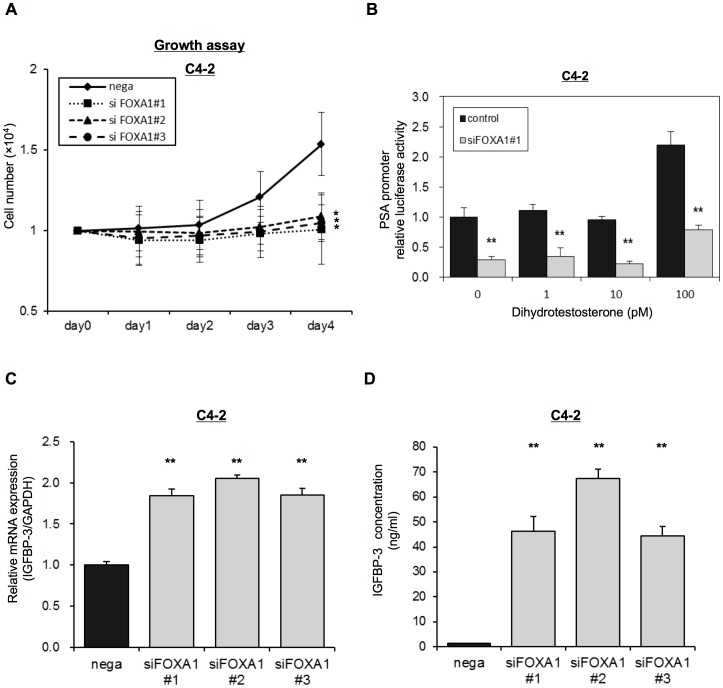
Fork-head box protein A1 (FOXA1) is a "pioneer factor" that is known to bind to the androgen receptor (AR) and regulate the transcription of AR-specific genes. However, the precise role of FOXA1 in prostate cancer (PC) remains unknown. In this study, we report that FOXA1 plays a critical role in PC cell proliferation. The expression of FOXA1 was higher in PC than in normal prostate tissues (P = 0.0002), and, using immunohistochemical analysis, we found that FOXA1 was localized in the nucleus. FOXA1 expression levels were significantly correlated with both PSA and Gleason scores (P = 0.016 and P = 0.031, respectively). Moreover, FOXA1 up-regulation was a significant factor in PSA failure (P = 0.011). Depletion of FOXA1 in a prostate cancer cell line (LNCaP) using small interfering RNA (siRNA) significantly inhibited AR activity, led to cell-growth suppression, and induced G0/G1 arrest. The anti-proliferative effect of FOXA1 siRNA was mediated through insulin-like growth factor binding protein 3 (IGFBP-3). An increase in IGFBP-3, mediated by depletion of FOXA1, inhibited phosphorylation of MAPK and Akt, and increased expression of the cell cycle regulators p21 and p27. We also found that the anti-proliferative effect of FOXA1 depletion was significantly reversed by simultaneous siRNA depletion of IGFBP-3. These findings provide direct physiological and molecular evidence for a role of FOXA1 in controlling cell proliferation through the regulation of IGFBP-3 expression in PC.


Conflict of interest statement

Competing Interests: The authors have declared that no competing interests exist.

Figures

Figure 1
Figure 1. Clinical significance of FOXA1 in prostate cancer (PC).
The protein expression of FOXA1 in representative normal adjacent to tumor (NAT) tissue (A) and PC tissue (B), as analyzed using IHC, is shown. NAT displayed low FOXA1 protein expression. FOXA1-positive staining was observed in cases of PC. Positive FOXA1 immunostaining was detected in the nucleus. Original magnification, ×400. (C) Quantification of FOXA1 staining of NAT and PC tissues. The FOXA1 IHC scores were calculated as follows: IHC score  = 1×(number of weakly stained cells in the field)+2×(number of moderately stained cells in the field)+3×(number of intensely stained cells in the field). The FOXA1 IHC scores for normal prostate tissues and for PCs ranged from 30.2 to 123.0 (median, 73.3) and from 20.4 to 260.1 (median, 125.1), respectively. Up-regulated FOXA1 expression (D) was significantly associated with PSA failure (P = 0.011) but up-regulated AR expression (E) was not (P = 0.4457). Log-rank statistics were used to test the difference in survival times between the groups. FOXA1 (+), up-regulated FOXA1; FOXA1 (–), down-regulated FOXA1. AR (+), up-regulated AR; AR (–), down-regulated AR. **indicates a statistical difference of P<0.01.
Figure 2
Figure 2. FOXA1 regulates AR activity in LNCaP cells.
(A) The mRNA expression and the protein expression of FOXA1 in four PC-derived cell lines (PC-3, DU-145, LNCaP, C4-2) and in non-tumorigenic prostate cell line (RWPE-1) were analyzed using qRT-PCR and Western blotting, respectively. (B) LNCaP cells were transfected with a negative control siRNA (nega) or with one of three different FOXA1 siRNAs (siFOXA1#1–3). After 48 h transfection, RNA was extracted and FOXA1 mRNA was analyzed using qRT-PCR analysis. FOXA1 mRNA expression is expressed relative to GAPDH mRNA expression in the same cell. The results shown are the means ± S.E.M. of three independent experiments. Proteins were extracted 72 h after transfection and FOXA1 and GAPDH protein expression was examined by Western blot analyses. (C, D) LNCaP cells were transfected with the pGL3-PSAp 5.8 luciferase reporter plasmid and with one of three different FOXA1 siRNAs. (#1–3) and were then grown in Phenol red–free RPMI-1640 medium containing 5% CS-FBS. (C) After 72 h transfection, luciferase activities were measured using the Dual-luciferase reporter assay system. Luciferase activities are expressed relative to the control, which was assigned a value of 1. Proteins were extracted 72 h after transfection and the expression of AR and GAPDH was examined by western blot analysis. (D) The transfected cells were incubated with the indicated concentrations of dihydrotestosterone for 72 h, and luciferase activities were measured as in (C). (E, F) Non-transfected LNCaP cells were treated with the indicated concentrations of dihydrotestosterone (E) or bicalutamide (F) for 48 h and FOXA1 mRNA expression was then analyzed using qRT-PCR. FOXA1 mRNA expression is expressed relative to GAPDH mRNA expression in the same cell. Values shown are the means ± SD from at least 3 independent experiments, each performed in triplicate. * and ** indicate statistical difference of P<0.05 and P<0.01, respectively.
Figure 3
Figure 3. FOXA1 regulates PC cell proliferation in IGFBP-3 dependent manner.
(A) LNCaP cells were transfected with a negative control siRNA (nega) or with one of three different FOXA1 siRNAs (#1–#3), and were then reseeded into a 24-well culture plate. Cell proliferation was then assayed over 4 days by counting the number of cells for each transfection condition, as indicated. (B) The cell-cycle stage of the cells was analyzed using propidium iodide staining and FACS analysis 24 h after siRNA transfection and the percentage of cells in each transfected population that was in each cycle phase was calculated. (C) LNCaP cells were transfected with a negative control siRNA (nega) or with one of three different FOXA1 siRNAs (siFOXA1#1–3). After 48 h of transfection IGFBP-3 mRNA expression was analyzed by qRT-PCR. IGFBP-3 mRNA expression is expressed relative to GAPDH mRNA expression in the same cell. (D) LNCaP cells were transfected with a negative control siRNA (nega) or with one of three different FOXA1 siRNAs (siFOXA1#1–3). After 72 h of transfection, IGFBP-3 concentration of the media was analyzed by ELISAs. (E) Proteins were extracted 72 h after transfection and the expression of IGFBP3, of the insulin-receptor signaling related proteins (total amount of MAPK, phospho-MAPK, total amount of Akt and phospho-Akt), of G0/G1 arrest-related cell cycle regulatory proteins (p21cip1, p27kip1) and of GAPDH was examined by western blot analysis. Protein molecular weights are indicated at right sides of the panel. These results are the means ± S.E.M. of three independent experiments. **indicates a statistical difference of P<0.01.
Figure 4
Figure 4. Regulation of IGFBP-3 expression and AR activity through FOXA1.
(A) LNCaP cells were transfected with a negative control siRNA (nega) or with an IGFBP-3 siRNA (siIGFBP-3) and, 48 h later, IGFBP-3 mRNA and protein levels were analyzed using qRT-PCR and Western blot analysis. IGFBP-3 mRNA expression is expressed relative to GAPDH mRNA expression in the same cell. (B) LNCaP cells were transfected with a negative control siRNA (nega) or with one of three FOXA1 siRNAs (siFOXA1#1–#3) and/or an IGFBP-3 siRNA (siIGFBP-3), and were reseeded into a 24-well culture plate. Cell proliferation was measured over 4 days and the number of cells for each transfected population is indicated. (C, D) LNCaP cells were transfected with a negative control siRNA (nega) or with an AR siRNA (si AR) and/or a FOXA1 siRNA (si FOXA1#1) and, 48 h after transfection, AR mRNA and protein (C) or IGFBP-3 mRNA levels (D) were analyzed using qRT-PCR and/or western blot analysis. The mRNA levels are expressed relative to GAPDH mRNA expression in the same cell. The results shown are the means ± S.E.M. of three independent experiments. ** indicate statistical difference of P<0.01.
Figure 5
Figure 5. FOXA1 also regulates C4-2 cell proliferation in IGFBP-3 dependent manner.
(A) C4-2 cells were transfected with a negative control siRNA (nega) or with one of three FOXA1 siRNAs (#1–#3) and were then reseeded into a 24-well culture plate with Phenol red–free RPMI-1640 medium containing 5% CS-FBS. Cell proliferation was then measured over 4 days and is shown as the number of cells for each transfected population. (B) C4-2 cells were transfected with the pGL3-PSAp 5.8 luciferase reporter and with a FOXA1 siRNA (#1) and were grown in Phenol red–free RPMI-1640 medium containing 5% CS-FBS with the indicated concentrations of dihydrotestosterone (1–100 pM). Following 72 h transfection, luciferase activity was measured using the Dual-luciferase reporter assay system. (C) C4-2 cells were transfected with a negative control siRNA (nega) or with one of three different FOXA1 siRNAs (siFOXA1#1–3). After 48 h of transfection IGFBP-3 mRNA expression was analyzed by qRT-PCR. IGFBP-3 mRNA expression is expressed relative to GAPDH mRNA expression in the same cell. (D) C4-2 cells were transfected with a negative control siRNA (nega) or with one of three different FOXA1 siRNAs (siFOXA1#1–3). After 72 h of transfection, IGFBP-3 concentration of the media was analyzed by ELISAs. The results shown are the means ± S.E.M. of three independent experiments. * and ** indicate statistical difference of P<0.05 and P<0.01, respectively.

Similar articles

Cited by

References

    1. Mulholland DJ, Tran LM, Li Y, Cai H, Morim A, et al. (2011) Cell autonomous role of PTEN in regulating castration-resistant prostate cancer growth. Cancer Cell 19: 792–804. - PMC - PubMed
    1. Li R, Wheeler T, Dai H, Frolov A, Thompson T, et al. (2004) High level of androgen receptor is associated with aggressive clinicopathologic features and decreased biochemical recurrence-free survival in prostate: cancer patients treated with radical prostatectomy. Am J Surg Pathol 28: 928–934. - PubMed
    1. Dutt SS, Gao AC (2009) Molecular mechanisms of castration-resistant prostate cancer progression. Future Oncol 5: 1403–1413. - PMC - PubMed
    1. Endo T, Uzawa K, Suzuki H, Tanzawa H, Ichikawa T (2009) Characteristic gene expression profiles of benign prostatic hypertrophy and prostate cancer. Int J Oncol 35: 499–509. - PubMed
    1. Augello MA, Hickey TE, Knudsen KE (2011) FOXA1: master of steroid receptor function in cancer. EMBO J 30: 3885–3894. - PMC - PubMed

Publication types

MeSH terms