. 2012;7(8):e42644.
doi: 10.1371/journal.pone.0042644. Epub 2012 Aug 3.

DYT1 knock-in mice are not sensitized against mitochondrial complex-II inhibition

Affiliations

DYT1 knock-in mice are not sensitized against mitochondrial complex-II inhibition

Nicole Bode et al. PLoS One. 2012.

Abstract

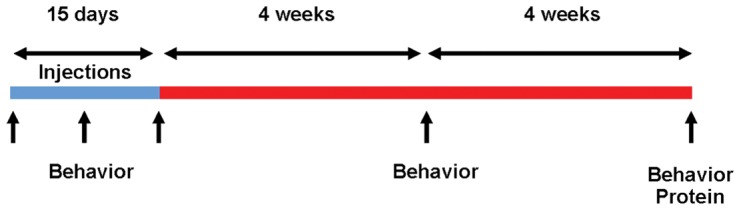
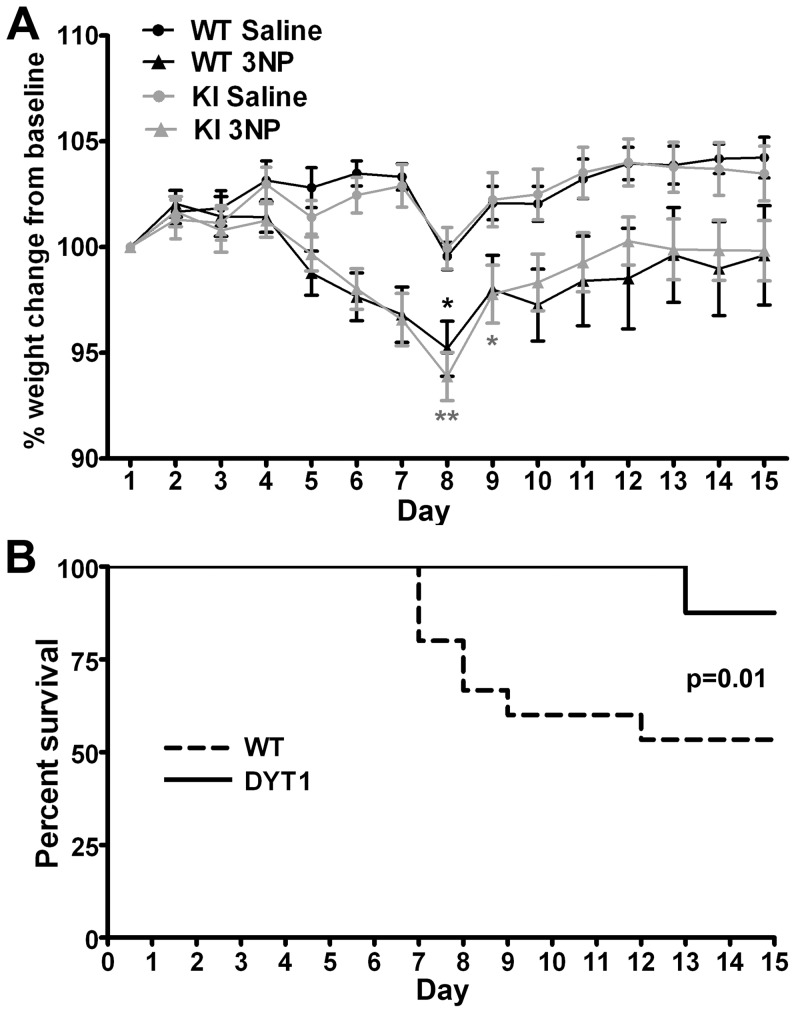
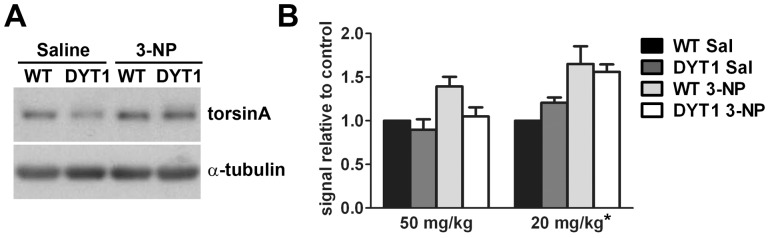
DYT1 is caused by a partly penetrant dominant mutation in TOR1A that leads to a glutamic acid deletion (ΔE) in torsinA. Identifying environmental factors that modulate disease pathogenesis and penetrance could help design therapeutic strategies for dystonia. Several cell-based studies suggest that expression of torsinA(ΔE) increases the susceptibility of neuronal cells to challenges to their oxidative/energy metabolism. Based on those reports, we hypothesized that mice expressing torsinA(ΔE) would be more susceptible than control littermates to the effects of oxidative stress and ATP deficits caused by disruption of the mitochondrial respiratory chain in neurons. To test this hypothesis, we administered 20 or 50 mg/kg/day of the irreversible complex-II inhibitor 3-nitropropionic acid (3-NP) intraperitoneally for 15 consecutive days to young heterozygote DYT1 knock-in (KI) mice and wild type littermates. Repeated phenotypic assessments were performed at baseline, during and after the injections. Animals were then sacrificed and their brains processed for protein analysis. The administration of 20 mg/kg 3-NP led to increased levels of torsinA in the striatum, the main target of 3-NP, but did not cause motor dysfunction in DYT1 KI or control mice. The administration of 50 mg/kg/day of 3-NP caused the death of ~40% of wild type animals. Interestingly, DYT1 KI animals showed significantly reduced mortality. Surviving animals exhibited abnormal motor behavior during and right after the injection period, but recovered by 4 weeks postinjection independent of genotype. In contrast to the findings reported in cultured cells, these studies suggest the DYT1 mutation does not sensitize central neurons against the toxic effects of oxidative stress and energy deficits.


Conflict of interest statement

Competing Interests: The authors have declared that no competing interests exist.

Figures

Figure 1
Figure 1. Experimental design.
Mice were 6–8 weeks of age at the beginning of the injections. Behavioral analyses include spontaneous locomotion and performance on the rotarod. Blue: acute toxicity period. Red: recovery period.
Figure 2
Figure 2. DYT1 KI mice are resistant to death caused by 3-NP.
(A) Change in weight during the injection period expressed as a percentage of the initial weight. Two way ANOVA for repeated measures demonstrates a significant interaction between time and experimental group (F[42,630] = 3.34; p<0.0001). Post-test Bonferroni was done using the WT Saline group as a reference (*p<0.05; **p<0.01). (B) Kaplan Meyer survival curve for DYT1 and control mice demonstrates statistically significant differences in mortality upon treatment with 3-NP between both genotypes. The Gehan-Breslow-Wilcoxon test was used for statistical analysis. All animals that received saline survived. There was no mortality beyond the injection period.
Figure 3
Figure 3. The effects of 3-NP on motor behavior are not influenced by the DYT1 genotype.
(A) Distance traveled over a 30 minutes period at baseline, at day 8 of the injections (“crisis”), at the end of the IP injections and 4 and 8 weeks later. Repeated measures two-way ANOVA showed no interaction between genotype and time point for animals receiving saline or 3-NP and no effect of genotype but a significant effect of time in both the saline (F[4,84] = 11.83; p<0.0001) and 3-NP (F[4,92] = 29.42; p<0.0001) groups. Post-hoc Bonferroni analysis was performed comparing each time point to the baseline value, with significance shown in the graph (*p<0.05, **p<0.01, ***p<0.001, ****p<0.0001) (B) The pattern of the movement was affected by the administration of 3-NP, as mice developed hindlimb dysfunction. Shown are representative plots of locomotion for individual animals at day 16. Black line denotes no movement, green line slow movements and red line fast movements. (C) Analysis of the number of transitions between speeds per distance, indicating erratic movements, indicates a significant worsening of the gait pattern in the immediate post-injection period for the 3-NP group. Repeated measures ANOVA demonstrated no interaction between genotype and performance over time and no effect of genotype in the saline and 3-NP groups. There was a significant effect of time in the saline (F[4,84] = 3.44; p = 0.01) and 3-NP (F[4,92] = 9.38; p<0.0001) groups. Post-hoc Bonferroni analysis comparing each value to baseline demonstrates a significant increment in the number of transitions at days 8 and 16 for the 3-NP but not the saline group (*p<0.05, **p<0.01).
Figure 4
Figure 4. DYT1 genotype does not influence performance in the rotarod after the administration of 3-NP.
The latency to fall from the accelerating rotarod was measured 3 times daily for 3 consecutive days at the different time-points indicated. The average value for each time point was used for analysis. Two-way ANOVA for repeated measures showed no interaction between genotype and time point for the saline or 3-NP groups and no effect of genotype. Time influenced performance in both the saline (F[3,66] = 16.72; p<0.0001) and 3-NP (F[3,69] = 8.81; p<0.0001) groups. Post-test Bonferroni comparisons to performance at baseline were done (*p<0.05, **p<0.01, ***p<0.001, ****p<0.0001).
Figure 5
Figure 5. Levels of torsinA in the striatum are slightly increased upon treatment with 3-NP.
(A) Representative western blot showing torsinA expression in striatal lysates of animals receiving 50 mg/kg/day of 3-NP or saline controls. (B) Quantification of torsinA expression as described in the text for animals that received 50 or 20 mg/kg/day of 3-NP (N: 5–7/group). ANOVA showed a non-significant trend in the 50 mg/kg/day group (p = 0.07) and significant differences in the 20 mg/kg/day group (*p = 0.01).

References

    1. Fahn S, Bressman SB, Marsden CD (1998) Classification of dystonia. Adv Neurol 78: 1–10. - PubMed
    1. Tassone A, Sciamanna G, Bonsi P, Martella G, Pisani A (2011) Experimental models of dystonia. International review of neurobiology 98: 551–572. - PubMed
    1. Gonzalez-Alegre P (2007) The inherited dystonias. Seminars in neurology 27: 151–158. - PubMed
    1. Ozelius LJ, Hewett JW, Page CE, Bressman SB, Kramer PL, et al. (1997) The early-onset torsion dystonia gene (DYT1) encodes an ATP-binding protein. Nature genetics 17: 40–48. - PubMed
    1. Bressman SB, Sabatti C, Raymond D, de Leon D, Klein C, et al. (2000) The DYT1 phenotype and guidelines for diagnostic testing. Neurology 54: 1746–1752. - PubMed

Publication types

MeSH terms