. 2012;7(8):e42650.
doi: 10.1371/journal.pone.0042650. Epub 2012 Aug 3.

Widespread state-dependent shifts in cerebellar activity in locomoting mice

Affiliations

Widespread state-dependent shifts in cerebellar activity in locomoting mice

Ilker Ozden et al. PLoS One. 2012.

Abstract

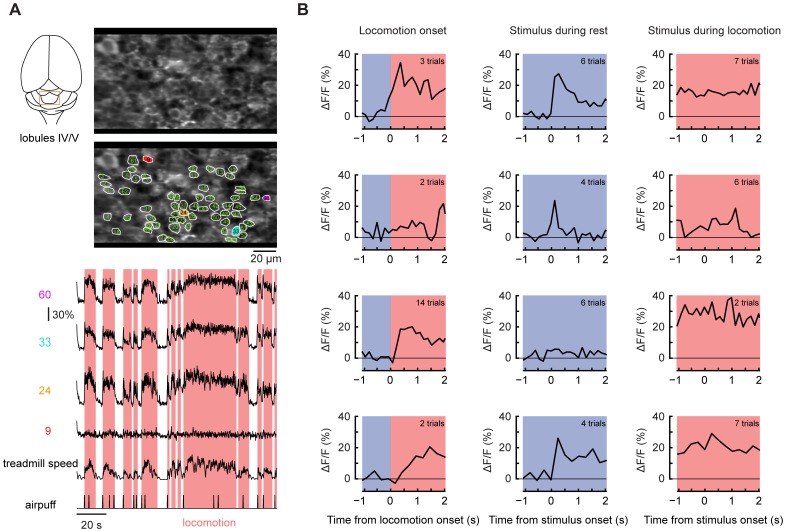
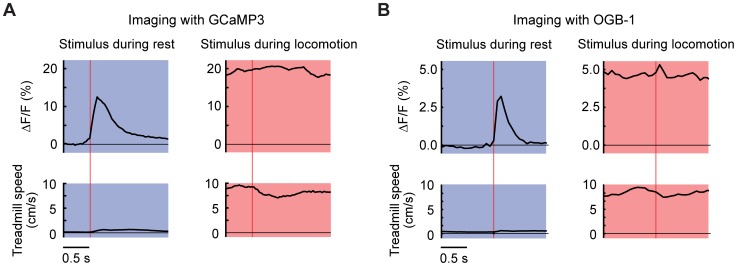
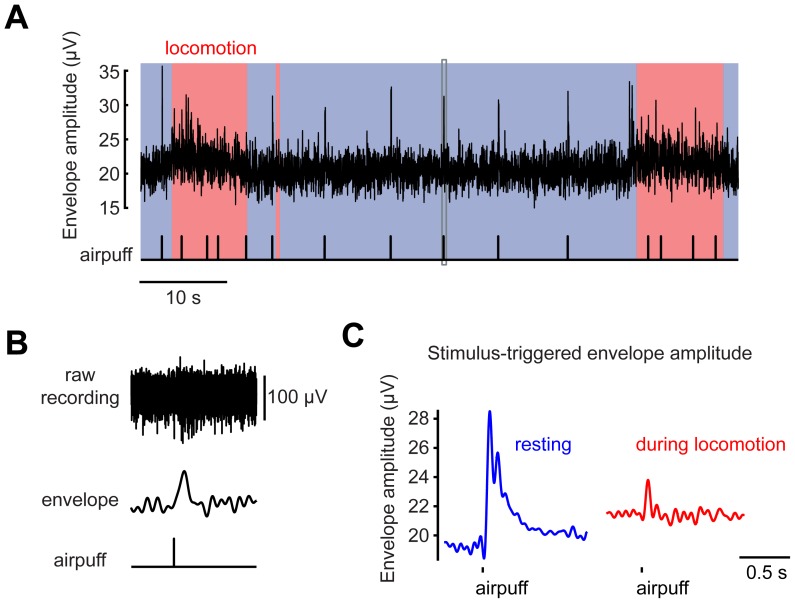
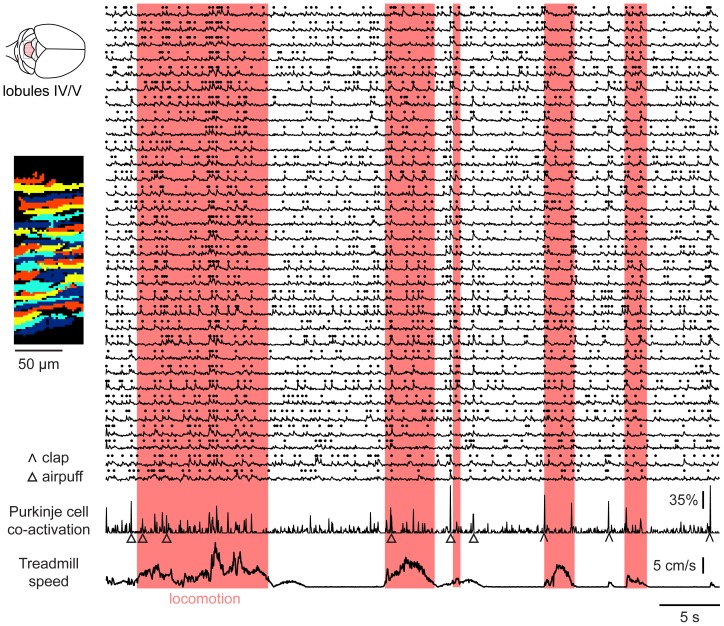
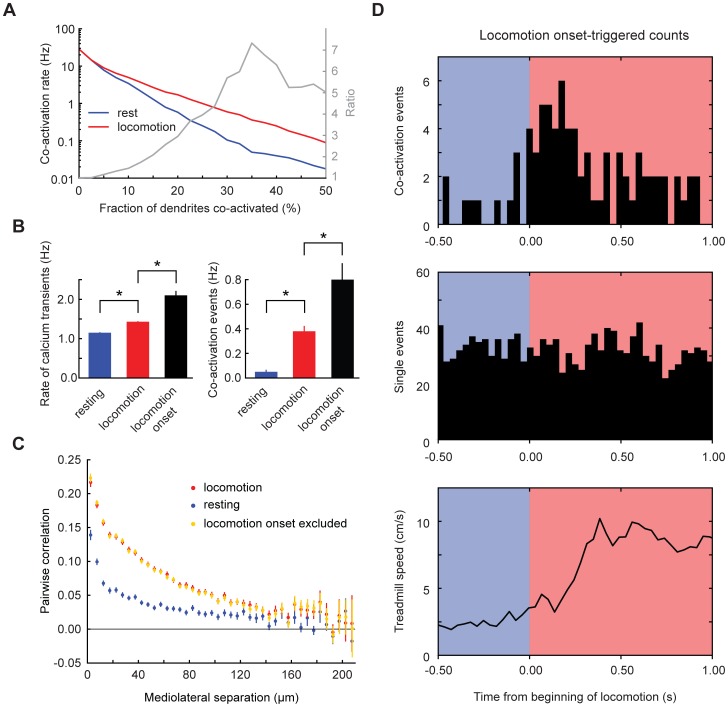
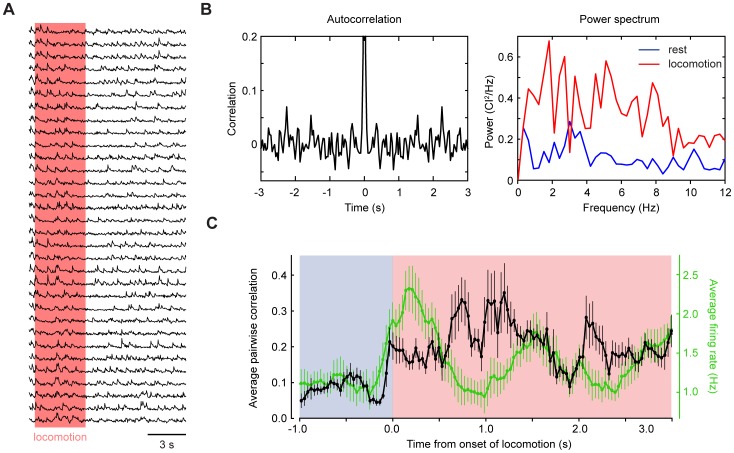
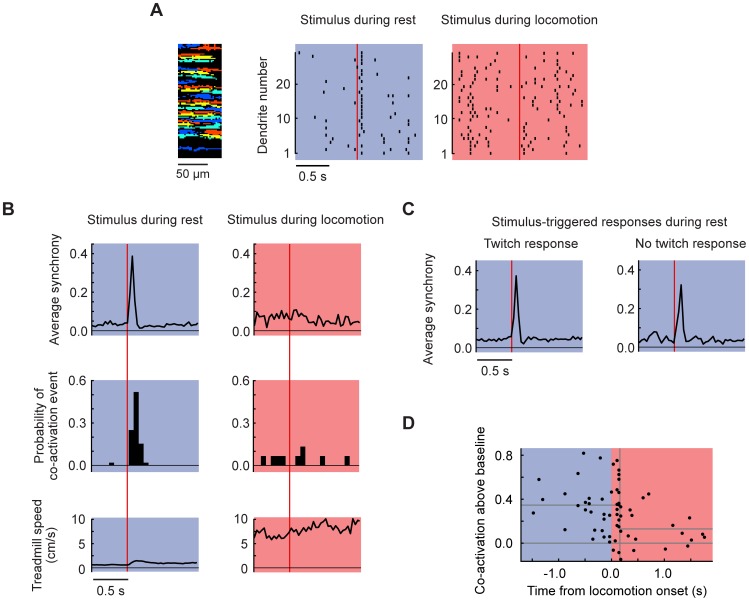
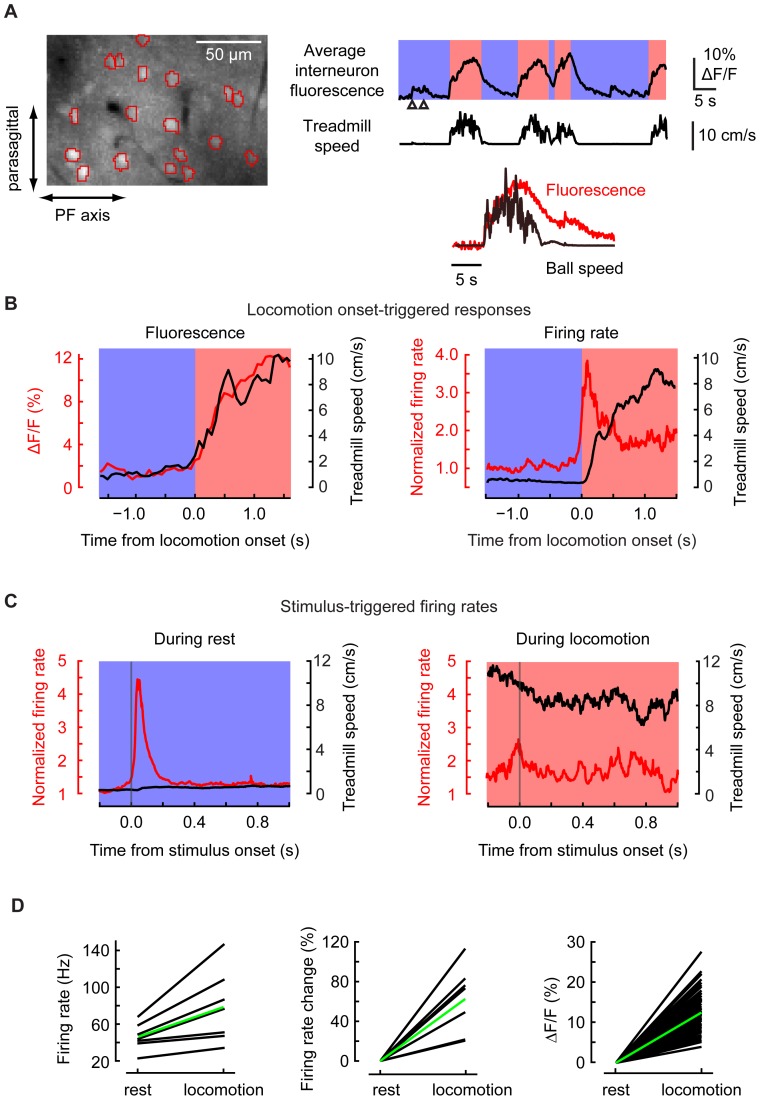
Excitatory drive enters the cerebellum via mossy fibers, which activate granule cells, and climbing fibers, which activate Purkinje cell dendrites. Until now, the coordinated regulation of these pathways has gone unmonitored in spatially resolved neuronal ensembles, especially in awake animals. We imaged cerebellar activity using functional two-photon microscopy and extracellular recording in awake mice locomoting on an air-cushioned spherical treadmill. We recorded from putative granule cells, molecular layer interneurons, and Purkinje cell dendrites in zone A of lobule IV/V, representing sensation and movement from trunk and limbs. Locomotion was associated with widespread increased activity in granule cells and interneurons, consistent with an increase in mossy fiber drive. At the same time, dendrites of different Purkinje cells showed increased co-activation, reflecting increased synchrony of climbing fiber activity. In resting animals, aversive stimuli triggered increased activity in granule cells and interneurons, as well as increased Purkinje cell co-activation that was strongest for neighboring dendrites and decreased smoothly as a function of mediolateral distance. In contrast with anesthetized recordings, no 1-10 Hz oscillations in climbing fiber activity were evident. Once locomotion began, responses to external stimuli in all three cell types were strongly suppressed. Thus climbing and mossy fiber representations can shift together within a fraction of a second, reflecting in turn either movement-associated activity or external stimuli.


Conflict of interest statement

Competing Interests: The authors have declared that no competing interests exist.

Figures

Figure 1
Figure 1. Locomotion- and stimulus-associated signals in granule cell layer neurons recorded using the calcium indicator protein G-CaMP3.
(A) A field of view showing 62 putative granule cells (GCs) with four example fluorescence traces. The labels at left of traces indicate the neurons monitored in the image. (B) Example traces from putative GCs representative of a few selected categories (see Table 1 ) of responsiveness during locomotion and in response to stimuli presented during rest or locomotion: Row 1, locomotion-responsive cell responding to stimuli during rest but not running; Row 2, locomotion-unresponsive cell responding to stimuli only during rest; Row 3, locomotion-responsive cell unresponsive to stimuli at all times; Row 4, locomotion responsive cell responding to stimuli at all times. For each row: left column, locomotion onset-triggered averages; center, stimulus-triggered averages during rest; right, stimulus-triggered averages during locomotion. The pink-shaded regions indicate epochs of locomotion identified from video recordings.
Figure 2
Figure 2. Locomotion-dependence of responses in imaged putative cerebellar granule cells.
(A) Averaged across all cells imaged using GCaMP3, stimulus-triggered fluorescence average in resting mice (top left) and during locomotion (top right). Bottom, treadmill speed averages. Vertical lines indicate stimulus time. (B) The same plots as in (A) for the responses obtained in experiments with OGB-1.
Figure 3
Figure 3. Locomotion- and stimulus-associated multiunit signals in the granule cell layer.
(A) The signal envelope of the multiunit recordings from the granule cell layer in an awake mouse during alternating periods of rest and locomotion (pink shaded region), including airpuff stimuli (bottom tick marks). The gray rectangle indicates the region expanded in (B). (B) The raw electrophysiological recording (top) and the signal envelope (middle) associated with one airpuff. (C) Stimulus-triggered averages of envelope signals at rest and during locomotion.
Figure 4
Figure 4. Locomotion-associated co-activation of Purkinje cell dendrites.
Example data set from an awake mouse on an air-cushioned treadmill, showing signals from cerebellar Purkinje cell dendrites bulk-loaded with the calcium indicator Oregon Green BAPTA-1/AM. Left, field of view showing 32 dendrites identified using independent component analysis on fluorescence transients. Center, fluorescence traces during alternating periods of rest and locomotion. Candidate complex spike-triggered events are indicated by dots. The pink-shaded regions indicate epochs of locomotion identified from video recordings.
Figure 5
Figure 5. Specific increases in co-activation of nearby Purkinje cell dendrites during locomotion.
(A) Determination of threshold for defining co-activation events. The frequency of events surpassing a given degree of co-activation was plotted for resting (blue) and locomotion (red) states. The ratio of the two quantities (black trace) shows a peak for a threshold of 35%, which therefore defines a level of maximum difference in co-activation between resting and locomotion. Co-activation events were therefore defined as events in which 35% or more dendrites were active at once. (B) Pooled across all experiments, average frequency of per-dendrite and multi-dendrite co-activation events as a function of behavioral state. (C) Pooled across all experiments, pairwise PC-PC correlation of event sequences as a function of mediolateral distance between dendrites. Error bars represent SEM. (D) Pooled across all experiments, locomotion-triggered histograms of co-activation events, single-dendrite-only events, and treadmill rotation speed.
Figure 6
Figure 6. Absence of 1–10 Hz oscillation in ensembles of Purkinje cell dendrites.
(A) Calcium signals from a typical population of imaged dendrites (B) Left panel, the autocorrelogram of the sum of dendritic events within the same field of view, calculated for the whole recording period. Right panel, frequency power spectra of signaling events during resting and locomotion. (C) Locomotion onset-triggered average firing rates and pairwise correlations show their variation around the point of behavioral change. The averages are calculated by a 387 ms sliding window. Error bars represent SEM.
Figure 7
Figure 7. Gated co-activation of Purkinje cell dendrites by external aversive stimuli.
(A) A raster plot from 29 Purkinje cell dendrites in response to a single clap stimulus (vertical line) during rest (left) or locomotion (right). (B) Data averaged from 5 mice from presentations of multiple stimuli in which the animal did not begin to move (left; 52 stimuli in 16 fields of view) or was already locomoting (right; 15 stimuli, 9 of the same fields of view). Top, average co-activation plotted frame by frame. Center, the probability of a co-activation event. Bottom, treadmill rotation speed. (C) Average synchrony response in resting animals divided according to whether the stimulus triggered a visible twitch. (D) Fraction of co-activated dendrites in the first 3 frames after a stimulus, plotted relative to the time of the nearest locomotion onset for all fields of view. Stimuli were given at various times distributed along the horizontal axis. Plotted values were corrected by subtracting the co-activation fraction (which was higher during locomotion) occurring at each time point when no stimulus was given. A break point (vertical line) 0.14 s after locomotion onset was identified by deviance minimization.
Figure 8
Figure 8. Locomotion and stimulus-dependent activity in molecular layer interneurons.
(A) Left, an example field of view showing 18 molecular layer interneurons. Right, averaged fluorescence from all interneurons during alternating periods of resting (blue shading) and locomotion (pink), including two airpuff stimuli (arrowheads). Inset, movement onset-triggered averages of treadmill rotation and fluorescence, taken from 7 episodes of movement. (B) Locomotion onset-triggered averages as measured by (left) fluorescence and (right) single-unit extracellular electrophysiological recording in the molecular layer. For both cases, the average treadmill speeds are shown in black. (C) Stimulus-triggered average responses to claps in mice at rest (52 claps, 7 cells) and during locomotion (7 claps, 4 cells) taken from extracellular recording. Vertical lines indicate the time of the clap. (D) Relative increases in interneuron activity during locomotion as depicted by electrophysiology (7 interneurons, left and middle panels) and imaging (75 interneurons, right panel). In each panel, dark lines indicate the activity of individual interneurons and green line the averaged activity over all interneurons.

References

    1. Bell CC, Han V, Sawtell NB (2008) Cerebellum-like structures and their implications for cerebellar function. Annu Rev Neurosci 31: 1–24. - PubMed
    1. Bloedel JR, Bracha V (1998) Current concepts of climbing fiber function. Anat Rec 253: 118–126. - PubMed
    1. Eccles JC, Provini L, Strata P, Táboříková H (1968) Analysis of electrical potentials evoked in the cerebellar anterior lobe by stimulation of hindlimb and forelimb nerves. Exp Brain Res 6: 171–194. - PubMed
    1. Eccles JC, Faber DS, Murphy JT, Sabah NH, Táboříková H (1971) Afferent volleys in limb nerves influencing impulse discharges in cerebellar cortex. I. In mossy fibers and granule cells. Exp Brain Res 13: 15–35. - PubMed
    1. Chadderton P, Margrie TW, Häusser M (2004) Integration of quanta in cerebellar granule cells during sensory processing. Nature 428: 856–860. - PubMed

Publication types