. 2012 Sep 4;84(17):7469-78.
doi: 10.1021/ac301572t. Epub 2012 Aug 20.

Increasing the multiplexing capacity of TMTs using reporter ion isotopologues with isobaric masses

Affiliations

Increasing the multiplexing capacity of TMTs using reporter ion isotopologues with isobaric masses

Graeme C McAlister et al. Anal Chem. .

Abstract

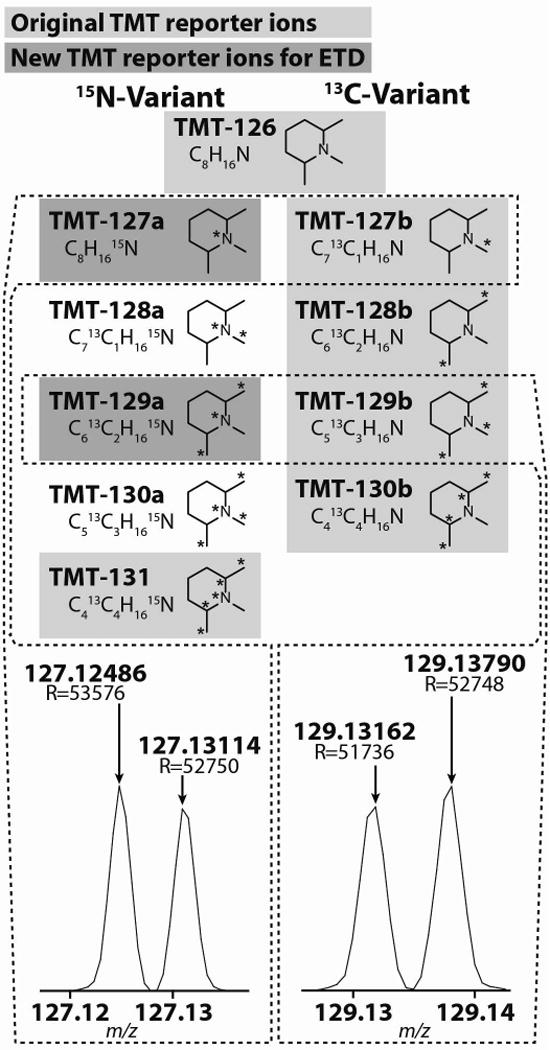
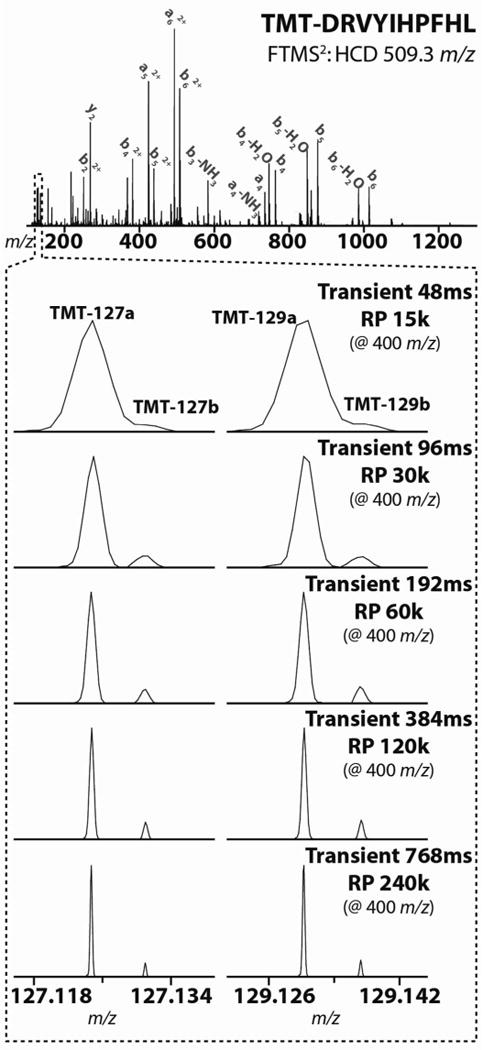
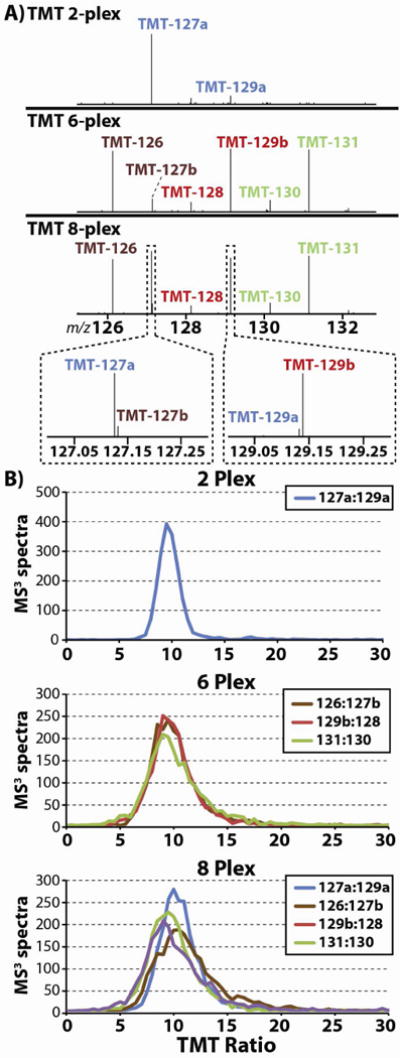
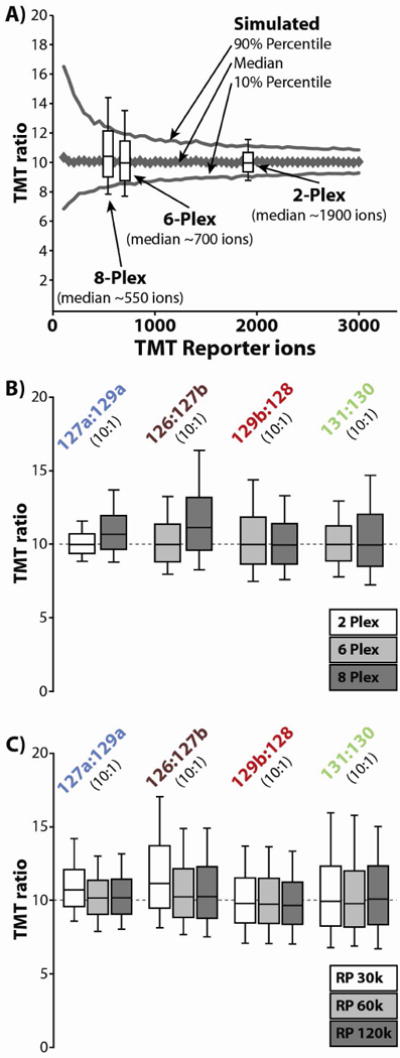
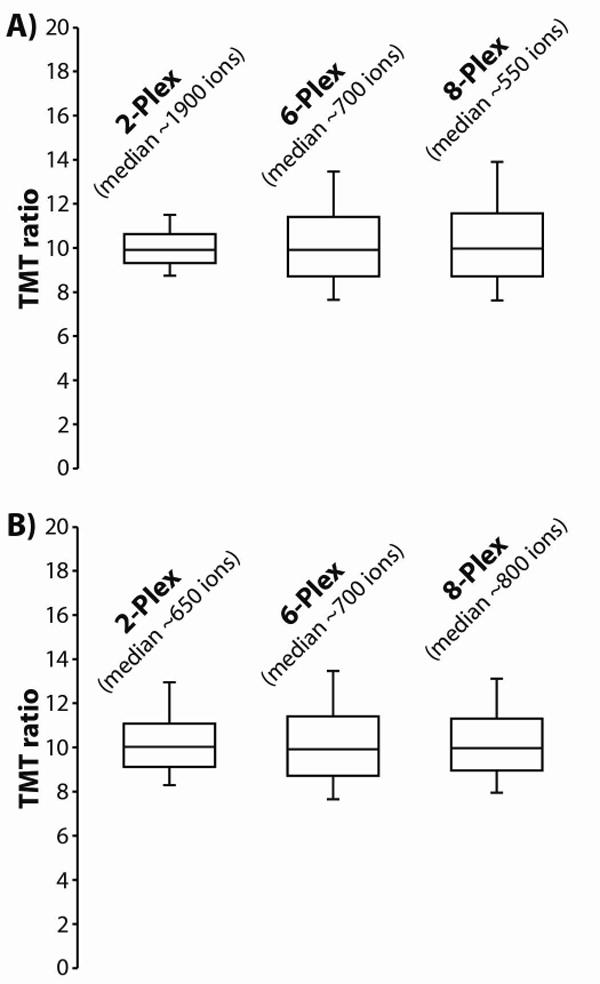
Quantitative mass spectrometry methods offer near-comprehensive proteome coverage; however, these methods still suffer with regards to sample throughput. Multiplex quantitation via isobaric chemical tags (e.g., TMT and iTRAQ) provides an avenue for mass spectrometry-based proteome quantitation experiments to move away from simple binary comparisons and toward greater parallelization. Herein, we demonstrate a straightforward method for immediately expanding the throughput of the TMT isobaric reagents from 6-plex to 8-plex. This method is based upon our ability to resolve the isotopic shift that results from substituting a (15)N for a (13)C. In an accommodation to the preferred fragmentation pathways of ETD, the TMT-127 and -129 reagents were recently modified such that a (13)C was exchanged for a (15)N. As a result of this substitution, the new TMT reporter ions are 6.32 mDa lighter. Even though the mass difference between these reporter ion isotopologues is incredibly small, modern high-resolution and mass accuracy analyzers can resolve these ions. On the basis of our ability to resolve and accurately measure the relative intensity of these isobaric reporter ions, we demonstrate that we are able to quantify across eight samples simultaneously by combining the (13)C- and (15)N-containing reporter ions. Considering the structure of the TMT reporter ion, we believe this work serves as a blueprint for expanding the multiplexing capacity of the TMT reagents to at least 10-plex and possibly up to 18-plex.


Figures

Figure 1
Figure 1
Previously there were only 6 TMT reagents available (highlighted in light grey). Due to complications arising from the preferred fragmentation pathways of ETD, the TMT-127, and -129 reporter ions were recently modified such that a 13C was exchanged for a 15N (dark grey). Though the new and old TMT-127 and -129 reagents only differ by ~6.32 mDa, high resolution mass spectrometers are capable of resolving these neighboring isobaric isotopologues.
Figure 2
Figure 2
The peptide AngioT (DRVYIHPFHL) was labeled with TMT-127a, -127b, -129a, and -129b. Following labeling, the differentially tagged peptides were mixed at 10:1 ratios and analyzed with a FTMS2 HCD scan on an Orbitrap Elite. Spectra were collected at a range of resolving powers (15k–240k @ 400 m/z). With the D20 Orbitrap analyzer, a relatively short transient of 96ms provides baseline resolution between the differentially expressed reporter ions.
Figure 3
Figure 3
(A) A complex mixture of LysC peptides – derived from unfractionated HeLa lysate – was split eight ways and labeled with the eight available TMT reagents. Three separate samples were prepared from the peptides: (1) a 2-plex mixture containing peptides labeled with TMT-127a and -129a and mixed at a 10:1 ratio; (2) a 6-plex mixture containing peptides labeled with TMT-126, -127b, -128, -129b, -130, and -131 and mixed at ratios of 10:1:1:10:1:10, respectively; and, (3) a sample containing (1) and (2) combined at a ratio of 1:1. (B) The 2-plex, 6-plex, and 8-plex mixtures were analyzed using the MS3 method, and the resulting distributions of TMT ratios are displayed here. We found that as the complexity of the reporter ion population increases from 2- to 8-plex the median ratio is unaffected and consistently centers on 10:1.
Figure 4
Figure 4
(A) The distribution of TMT ratios was simulated using a simple Poisson model for an expected ratio of 10:1 over a range of TMT ion counts. Overlaid onto this simulation are the observed distributions of TMT ratios from the TMT 2-, 6-, and 8-plex experiments. These experimental distributions were centered over the median number of charges observed in each experiment. In general the observed distribution matched closely with the expected distribution. For each experiment, the experimental error bars extend out beyond the expected values, most likely do to measurement error. (B) The different pairs of TMT ratios from the 2-, 6-, and 8-plex experiments are plotted against each other. These are the same distributions that were plotted in figure 3B. The ratios based upon the low abundance isobaric channels (i.e., 129a and 127b) diverge from the ratios based upon the low abundance standard channels (i.e., 128 and 130) in that the distributions skew towards higher ratios (> 10:1). (C) In a separate set of analyses, the 8-plex mixture was analyzed at resolving powers of 30k, 60k, and 120k (@ 400 m/z). As resolving power increases, the skewed distributions for ratios involving the low-abundance isobaric channels (i.e., 129a and 127b) shifts toward 10:1. Also, as resolving power increases, the distribution tightens, most likely due to improved analyzer accuracy.
Figure 5
Figure 5
(A) We analyzed the 2-, 6-, and 8-plex samples using the standard MS3 method. As the total number of TMT channels increases, the average number of charges per TMT channel decreases. This results in poor ion statistics, which produce wider distributions of observed TMT ratios. However, as shown in (B) by simply increasing the injection time we can compensate for the decrease in ion counts that result from an increase in reporter ion channels. We tuned the MS3 injection time to the number of reporter channels in the sample: for 2-plex experiments all injection times were multiplied by 0.333, for 8-plex experiments the times were multiplied by 1.333. For 6-plex experiments no additional data was collected. Following these adjustments, the median number of charges per TMT channel were roughly equivalent across the 2-, 6-, and 8-plex experiments. Consequently, the distributions of observed TMT ratios were also approximately equivalent for all three experiments.
Figure 6
Figure 6
(A) Quadruplicate mouse brain and spleen samples were labeled and the combined lysates were analyzed in a single LC-MS run to evaluate the performance of isobaric labeling for quantitative characterization at a proteomic scale. Relative reporter ion intensities are displayed as a heat map for 941 quantified proteins, ordered by their relative expression in brain (Br.) versus spleen (Sp.). Differentially expressed proteins were identified by Welsh’s T-Test (p < 0.01) with multiple testing correction by the method of Benjamini and Hochberg38 and are highlighted in green. Gene symbols from representative proteins are listed near their expression profiles. Reporter ion channels with standard spacing are colored orange, while isobaric channels are highlighted in blue. Notably, protein expression profiles are indistinguishable for brain and spleen replicates with either standard or isobaric labels. (B) To further probe the effects of isobaric labeling, each protein’s abundance profile was analyzed as depicted for Prkar2a. For each protein the mean ion count within each tissue was subtracted from each observed reporter ion count and the resulting difference was divided by the tissue mean. The resulting relative deviations were tallied for each reporter ion across all quantified proteins and the resulting distributions (C) were plotted as Box-Whisker plots for comparison. Similarly, relative deviations of log2 ratios observed for pairs of brain and spleen replicates compared with the overall average log2 ratio were plotted. If present, sub-optimal quantitation via isobaric labeling would be apparent either due to systematic shifts away from the mean (zero) or due to overall wider scatter in these distributions. However, no systematic differences between standard and isobaric labels are apparent, suggesting equivalent quantitative performance.

References

    1. Huttlin EL, Jedrychowski MP, Elias JE, Goswami T, Rad R, Beausoleil SA, Villen J, Haas W, Sowa ME, Gygi SP. A Tissue-Specific Atlas of Mouse Protein Phosphorylation and Expression. Cell. 2010;143(7):1174–1189. - PMC - PubMed
    2. Nagaraj N, Wisniewski JR, Geiger T, Cox J, Kircher M, Kelso J, Paabo S, Mann M. Deep proteome and transcriptome mapping of a human cancer cell line. Mol Syst Biol. 2011;7 - PMC - PubMed
    3. Beck M, Schmidt A, Malmstroem J, Claassen M, Ori A, Szymborska A, Herzog F, Rinner O, Ellenberg J, Aebersold R. The quantitative proteome of a human cell line. Mol Syst Biol. 2011;7 - PMC - PubMed
    4. Phanstiel DH, Brumbaugh J, Wenger CD, Tian SL, Probasco MD, Bailey DJ, Swaney DL, Tervo MA, Bolin JM, Ruotti V, Stewart R, Thomson JA, Coon JJ. Proteomic and phosphoproteomic comparison of human ES and iPS cells. Nature Methods. 2011;8(10):821–U84. - PMC - PubMed
    5. de Godoy LMF, Olsen JV, Cox J, Nielsen ML, Hubner NC, Frohlich F, Walther TC, Mann M. Comprehensive mass-spectrometry-based proteome quantification of haploid versus diploid yeast. Nature. 2008;455(7217):1251–U60. - PubMed
    1. DeSouza LV, Taylor AM, Li W, Minkoff MS, Romaschin AD, Colgan TJ, Siu KWM. Multiple reaction monitoring of mTRAQ-labeled peptides enables absolute quantification of endogenous levels of a potential cancer marker in cancerous and normal endometrial tissues. Journal of Proteome Research. 2008;7(8):3525–3534. - PubMed
    2. Gygi SP, Rist B, Gerber SA, Turecek F, Gelb MH, Aebersold R. Quantitative analysis of complex protein mixtures using isotope-coded affinity tags. Nature Biotechnology. 1999;17(10):994–999. - PubMed
    3. Li JX, Steen H, Gygi SP. Protein profiling with cleavable isotope-coded affinity tag (cICAT) reagents – The yeast salinity stress response. Molecular & Cellular Proteomics. 2003;2(11):1198–1204. - PubMed
    4. Hansen KC, Schmitt-Ulms G, Chalkley RJ, Hirsch J, Baldwin MA, Burlingame AL. Mass spectrometric analysis of protein mixtures at low levels using cleavable C-13-isotope-coded affinity tag and multidimensional chromatography. Molecular & Cellular Proteomics. 2003;2(5):299–314. - PubMed
    5. Ong SE, Blagoev B, Kratchmarova I, Kristensen DB, Steen H, Pandey A, Mann M. Stable isotope labeling by amino acids in cell culture, SILAC, as a simple and accurate approach to expression proteomics. Molecular & Cellular Proteomics. 2002;1(5):376–386. - PubMed
    6. Hsu JL, Huang SY, Chow NH, Chen SH. Stable-isotope dimethyl labeling for quantitative proteomics. Analytical Chemistry. 2003;75(24):6843–6852. - PubMed
    1. Hsu JL, Huang SY, Chen SH. Dimethyl multiplexed labeling combined with microcolumn separation and MS analysis for time course study in proteomics. Electrophoresis. 2006;27(18):3652–3660. - PubMed
    2. Morano C, Zhang X, Fricker LD. Multiple Isotopic Labels for Quantitative Mass Spectrometry. Analytical Chemistry. 2008;80(23):9298–9309. - PMC - PubMed
    3. Boersema PJ, Aye TT, van Veen TAB, Heck AJR, Mohammed S. Triplex protein quantification based on stable isotope labeling by peptide dimethylation applied to cell and tissue lysates. Proteomics. 2008;8(22):4624–4632. - PubMed
    1. Mertins P, Udeshi ND, Clauser KR, Mani DR, Patel J, Ong S-E, Jaffe JD, Carr SA. iTRAQ labeling is superior to mTRAQ for quantitative global proteomics and phosphoproteomics. Molecular & Cellular Proteomics. 2011 - PMC - PubMed
    1. Thompson A, Schafer J, Kuhn K, Kienle S, Schwarz J, Schmidt G, Neumann T, Hamon C. Tandem mass tags: A novel quantification strategy for comparative analysis of complex protein mixtures by MS/MS. Analytical Chemistry. 2003;75(8):1895–1904. - PubMed
    2. Dayon L, Hainard A, Licker V, Turck N, Kuhn K, Hochstrasser DF, Burkhard PR, Sanchez JC. Relative quantification of proteins in human cerebrospinal fluids by MS/MS using 6-plex isobaric tags. Analytical Chemistry. 2008;80(8):2921–2931. - PubMed
    3. Ross PL, Huang YLN, Marchese JN, Williamson B, Parker K, Hattan S, Khainovski N, Pillai S, Dey S, Daniels S, Purkayastha S, Juhasz P, Martin S, Bartlet-Jones M, He F, Jacobson A, Pappin DJ. Multiplexed protein quantitation in Saccharomyces cerevisiae using amine-reactive isobaric tagging reagents. Molecular & Cellular Proteomics. 2004;3(12):1154–1169. - PubMed
    4. Choe L, D’Ascenzo M, Relkin NR, Pappin D, Ross P, Williamson B, Guertin S, Pribil P, Lee KH. 8-Plex quantitation of changes in cerebrospinal fluid protein expression in subjects undergoing intravenous immunoglobulin treatment for Alzheimer’s disease. Proteomics. 2007;7(20):3651–3660. - PMC - PubMed

Publication types