Molecular dynamics simulation of lysozyme adsorption/desorption on hydrophobic surfaces
- PMID: 22882159
- PMCID: PMC3548063
- DOI: 10.1021/jp304057e
Molecular dynamics simulation of lysozyme adsorption/desorption on hydrophobic surfaces
Abstract
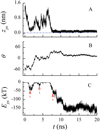
In this work, we present a series of fully atomistic molecular dynamics (MD) simulations to study lysozyme's orientation-dependent adsorption on polyethylene (PE) surface in explicit water. The simulations show that depending on the orientation of the initial approach to the surface the protein may adsorb or bounce from the surface. The protein may completely leave the surface or reorient and approach the surface resulting in adsorption. The success of the trajectory to adsorb on the surface is the result of different competing interactions, including protein-surface interactions and the hydration of the protein and the hydrophobic PE surface. The difference in the hydration of various protein sites affects the protein's orientation-dependent behavior. Side-on orientation is most likely to result in adsorption as the protein-surface exhibits the strongest attraction. However, adsorption can also happen when lysozyme's longest axis is tilted on the surface if the protein-surface interaction is large enough to overcome the energy barrier that results from dehydrating both the protein and the surface. Our study demonstrates the significant role of dehydration process on hydrophobic surface during protein adsorption.
Figures


Similar articles
-
Lysozyme adsorption on polyethylene surfaces: why are long simulations needed?Langmuir. 2011 Oct 4;27(19):12074-81. doi: 10.1021/la202622s. Epub 2011 Sep 12. Langmuir. 2011. PMID: 21846132 Free PMC article.
-
Forced Desorption of Bovine Serum Albumin and Lysozyme from Graphite: Insights from Molecular Dynamics Simulation.J Phys Chem B. 2016 Aug 18;120(32):7889-95. doi: 10.1021/acs.jpcb.6b05234. Epub 2016 Aug 9. J Phys Chem B. 2016. PMID: 27421144
-
Mesoscopic coarse-grained simulations of lysozyme adsorption.J Phys Chem B. 2014 May 1;118(17):4451-60. doi: 10.1021/jp409326f. Epub 2014 Mar 14. J Phys Chem B. 2014. PMID: 24785197
-
Calculation of solvation interaction energies for protein adsorption on polymer surfaces.J Biomater Sci Polym Ed. 1991;3(2):127-47. doi: 10.1163/156856291x00232. J Biomater Sci Polym Ed. 1991. PMID: 1768635 Review.
-
Fundamental Principles of the Thermodynamics and Kinetics of Protein Adsorption to Material Surfaces.Colloids Surf B Biointerfaces. 2020 Jul;191:110992. doi: 10.1016/j.colsurfb.2020.110992. Epub 2020 Apr 1. Colloids Surf B Biointerfaces. 2020. PMID: 32268265 Free PMC article. Review.
Cited by
-
Analysis of killing of growing cells and dormant and germinated spores of Bacillus species by black silicon nanopillars.Sci Rep. 2017 Dec 19;7(1):17768. doi: 10.1038/s41598-017-18125-z. Sci Rep. 2017. PMID: 29259282 Free PMC article.
-
Protein-Ligand Interaction Detection with a Novel Method of Transient Induced Molecular Electronic Spectroscopy (TIMES): Experimental and Theoretical Studies.ACS Cent Sci. 2016 Nov 23;2(11):834-842. doi: 10.1021/acscentsci.6b00217. Epub 2016 Oct 24. ACS Cent Sci. 2016. PMID: 27924312 Free PMC article.
-
Determination of protein conformation and orientation at buried solid/liquid interfaces.Chem Sci. 2023 Feb 14;14(11):2999-3009. doi: 10.1039/d2sc06958j. eCollection 2023 Mar 15. Chem Sci. 2023. PMID: 36937592 Free PMC article.
-
A bottom-up approach to understanding protein layer formation at solid-liquid interfaces.Adv Colloid Interface Sci. 2014 May;207:240-52. doi: 10.1016/j.cis.2013.12.006. Epub 2013 Dec 28. Adv Colloid Interface Sci. 2014. PMID: 24484895 Free PMC article. Review.
-
Albumin (BSA) adsorption onto graphite stepped surfaces.J Chem Phys. 2017 Jun 7;146(21):214704. doi: 10.1063/1.4984037. J Chem Phys. 2017. PMID: 28595417 Free PMC article.
References
-
- Messersmith PB. Science. 2008;319:1767–1768. - PubMed
-
- Lasseter TL, Clare BH, Abbott NL, Hamers RJ. J. Am. Chem. Soc. 2004;126:10220–10221. - PubMed
-
- Basset C, Harder C, Vidaud C, Dejugnat C. Biomacromolecules. 2010;11:806–814. - PubMed
-
- Wei T, Kaewtathip S, Shing K. J. Phys. Chem. C. 2009;113:2053–2062.
-
- Kim DT, Blanch HW, Radke CJ. Langmuir. 2002;18:5841–5850.
Publication types
MeSH terms
Substances
Grants and funding
LinkOut - more resources
Full Text Sources

