

Complex evaluation of human monocyte-derived dendritic cells for cancer immunotherapy
- PMID: 22882679
- PMCID: PMC4118250
- DOI: 10.1111/j.1582-4934.2012.01614.x
Complex evaluation of human monocyte-derived dendritic cells for cancer immunotherapy
Abstract
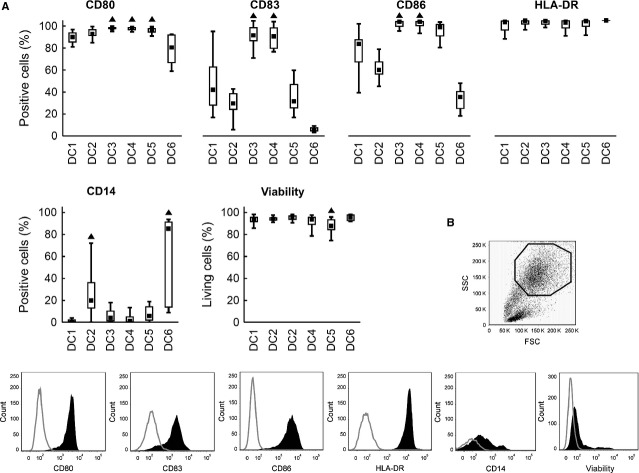
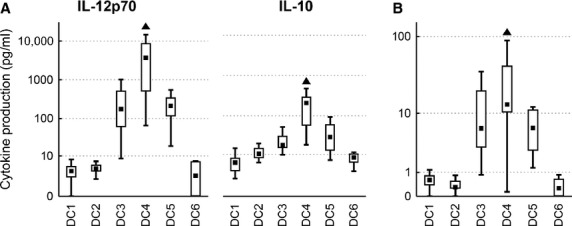
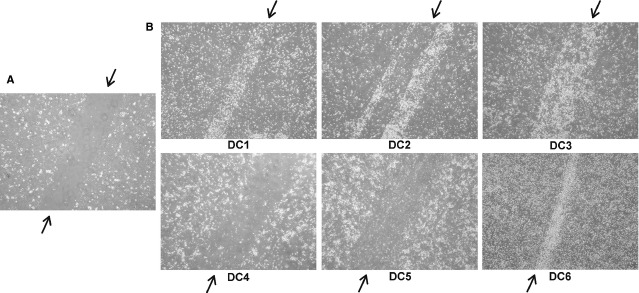
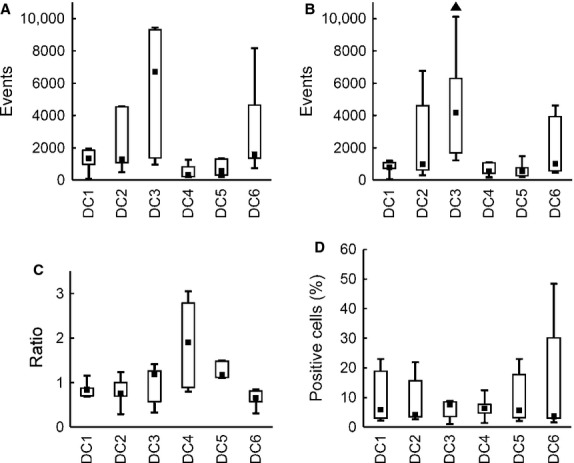
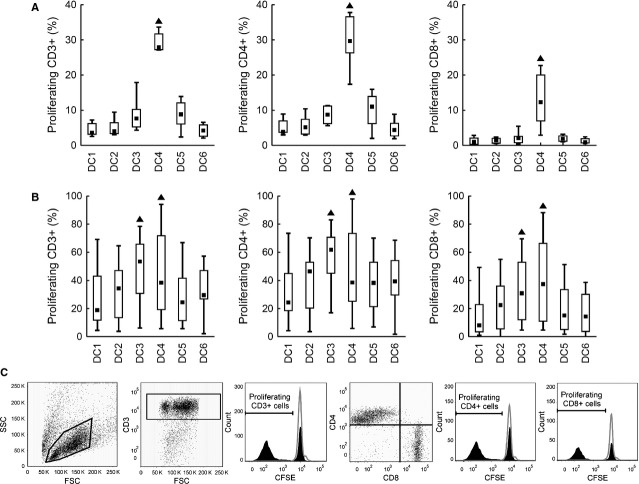
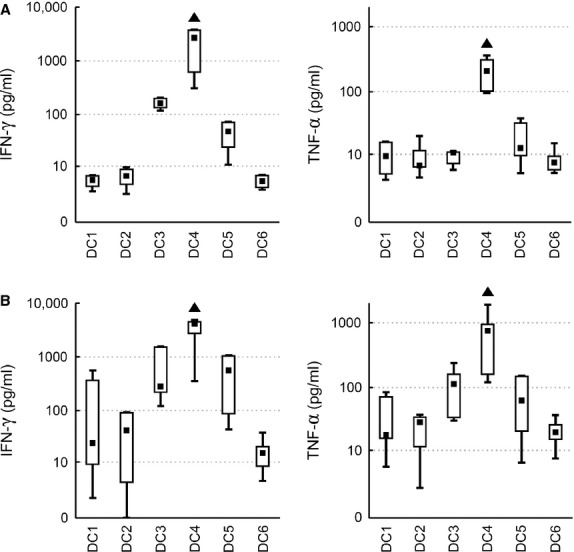
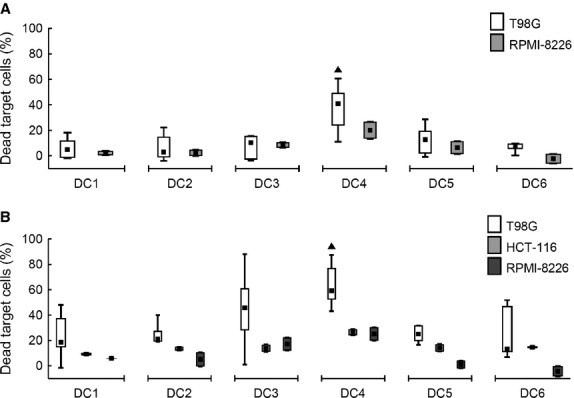
Dendritic cell (DC) immunotherapy is capable of generating tumour-specific immune responses. Different maturation strategies were previously tested to obtain DC capable of anti-cancer responses in vitro, usually with limited clinical benefit. Mutual comparison of currently used maturation strategies and subsequent complex evaluation of DC functions and their stimulatory capacity on T cells was performed in this study to optimize the DC vaccination strategy for further clinical application. DC were generated from monocytes using granulocyte-macrophage colony-stimulating factor (GM-CSF) and interleukin (IL)-4, pulsed with whole tumour cell lysate and then matured with one of five selected maturation strategies or cultured without additional maturation stimulus. DC were characterized with regard to their surface marker expression, cytokine profiles, migratory capacity, allogeneic and autologous T cell stimulatory capacity as well as their specific cytotoxicity against tumour antigens. We were able to demonstrate extensive variability among different maturation strategies currently used in DC immunotherapeutic protocols that may at least partially explain limited clinical benefit of some clinical trials with such DC. We identified DC matured with interferon-γ and lipopolysaccharide as the most attractive candidate for future clinical trials in cancer immunotherapy.
© 2012 The Authors Journal of Cellular and Molecular Medicine © 2012 Foundation for Cellular and Molecular Medicine/Blackwell Publishing Ltd.
Figures
Similar articles
-
A novel role for IL-3: human monocytes cultured in the presence of IL-3 and IL-4 differentiate into dendritic cells that produce less IL-12 and shift Th cell responses toward a Th2 cytokine pattern.J Immunol. 2002 Jun 15;168(12):6199-207. doi: 10.4049/jimmunol.168.12.6199. J Immunol. 2002. PMID: 12055233
-
Interferon-alpha disables dendritic cell precursors: dendritic cells derived from interferon-alpha-treated monocytes are defective in maturation and T-cell stimulation.Immunology. 2003 Sep;110(1):38-47. doi: 10.1046/j.1365-2567.2003.01702.x. Immunology. 2003. PMID: 12941139 Free PMC article.
-
IFN-alpha promotes definitive maturation of dendritic cells generated by short-term culture of monocytes with GM-CSF and IL-4.J Leukoc Biol. 2006 Aug;80(2):278-86. doi: 10.1189/jlb.1005592. Epub 2006 Jun 12. J Leukoc Biol. 2006. PMID: 16769767
-
Unexpected impairment of TNF-α-induced maturation of human dendritic cells in vitro by IL-4.J Transl Med. 2016 Apr 14;14:93. doi: 10.1186/s12967-016-0848-2. J Transl Med. 2016. PMID: 27080531 Free PMC article.
-
Role of the cytokine environment and cytokine receptor expression on the generation of functionally distinct dendritic cells from human monocytes.Eur J Immunol. 2008 Mar;38(3):750-62. doi: 10.1002/eji.200737395. Eur J Immunol. 2008. PMID: 18236400
Cited by
-
Oncolysate-loaded Escherichia coli bacterial ghosts enhance the stimulatory capacity of human dendritic cells.Cancer Immunol Immunother. 2017 Feb;66(2):149-159. doi: 10.1007/s00262-016-1932-4. Epub 2016 Nov 18. Cancer Immunol Immunother. 2017. PMID: 27864613 Free PMC article.
-
Recent Advances in Good Manufacturing Practice-Grade Generation of Dendritic Cells.Transfus Med Hemother. 2020 Dec;47(6):454-463. doi: 10.1159/000512451. Epub 2020 Oct 28. Transfus Med Hemother. 2020. PMID: 33442340 Free PMC article. Review.
-
Profiling changes in microRNAs of immature dendritic cells differentiated from human monocytes.Cent Eur J Immunol. 2021;46(1):10-16. doi: 10.5114/ceji.2021.105241. Epub 2021 Apr 18. Cent Eur J Immunol. 2021. PMID: 33897279 Free PMC article.
-
Enhanced stimulation of human tumor-specific T cells by dendritic cells matured in the presence of interferon-γ and multiple toll-like receptor agonists.Cancer Immunol Immunother. 2017 Oct;66(10):1333-1344. doi: 10.1007/s00262-017-2029-4. Epub 2017 Jun 10. Cancer Immunol Immunother. 2017. PMID: 28601925 Free PMC article.
-
Human Dendritic Cells: Their Heterogeneity and Clinical Application Potential in Cancer Immunotherapy.Front Immunol. 2019 Jan 21;9:3176. doi: 10.3389/fimmu.2018.03176. eCollection 2018. Front Immunol. 2019. PMID: 30719026 Free PMC article. Review.
References
-
- Banchereau J, Steinman RM. Dendritic cells and the control of immunity. Nature. 1998;392:245–52. - PubMed
-
- Steinman RM, Banchereau J. Taking dendritic cells into medicine. Nature. 2007;449:419–26. - PubMed
-
- Schuler G, Schuler-Thurner B, Steinman RM. The use of dendritic cells in cancer immunotherapy. Curr Opin Immunol. 2003;15:138–47. - PubMed
-
- Banchereau J, Palucka AK. Dendritic cells as therapeutic vaccines against cancer. Nat Rev Immunol. 2005;5:296–306. - PubMed
-
- Figdor CG, de Vries IJ, Lesterhuis WJ, et al. Dendritic cell immunotherapy: mapping the way. Nat Med. 2004;10:475–80. - PubMed
Publication types
MeSH terms
Substances
LinkOut - more resources
Full Text Sources
