

doi: 10.1111/j.1539-6924.2011.01775.x.
Chapter 5: Actual and counterfactual smoking prevalence rates in the U.S. population via microsimulation
Affiliations
- PMID: 22882892
- PMCID: PMC3478148
- DOI: 10.1111/j.1539-6924.2011.01775.x
Item in Clipboard
Chapter 5: Actual and counterfactual smoking prevalence rates in the U.S. population via microsimulation
Risk Anal.
2012 Jul.
Abstract
The smoking history generator (SHG) developed by the National Cancer Institute simulates individual life/smoking histories that serve as inputs for the Cancer Intervention and Surveillance Modeling Network (CISNET) lung cancer models. In this chapter, we review the SHG inputs, describe its outputs, and outline the methodology behind it. As an example, we use the SHG to simulate individual life histories for individuals born between 1890 and 1984 for each of the CISNET smoking scenarios and use those simulated histories to compute the corresponding smoking prevalence over the period 1975-2000.
© 2012 Society for Risk Analysis.
Figures
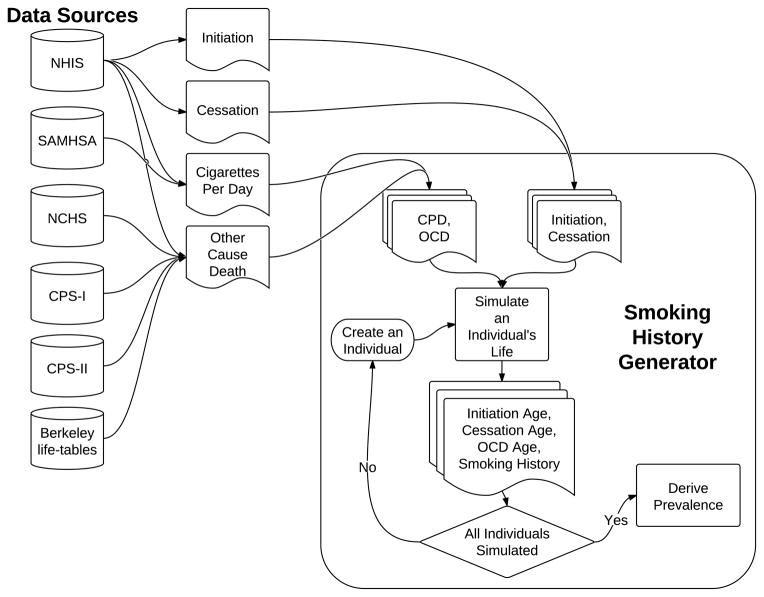
Flow diagram of the Smoking History Generator
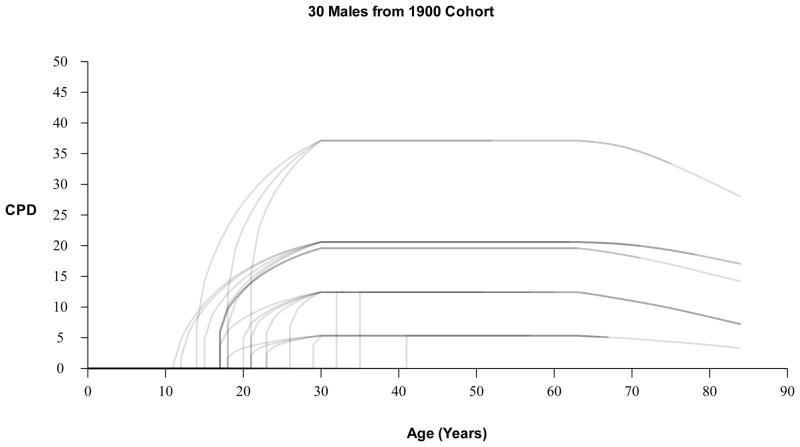
Examples of smoking dose (CPD) profiles for 30 males from the 1900 birth cohort.
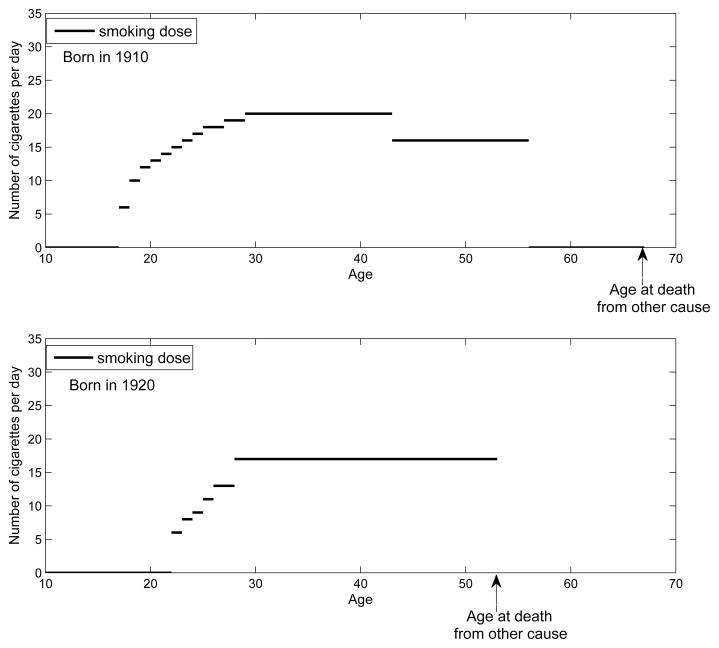
Examples of the SHG-generated events.
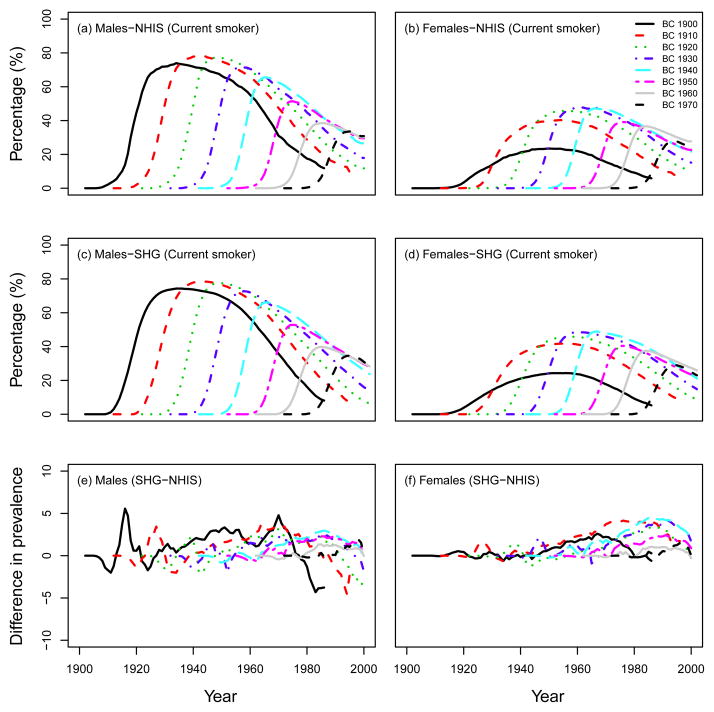
Percentage of current smokers in US males and females. Top row: observed data from the NHIS survey, middle row: computed prevalence using the SHG-generated data, adjusted for lung cancer deaths (ATC scenario). Bottom row: Difference between SHG-generated prevalence (SHG) and observed prevalence (NHIS), calculated by SHG-NHIS. BC=birth cohort.
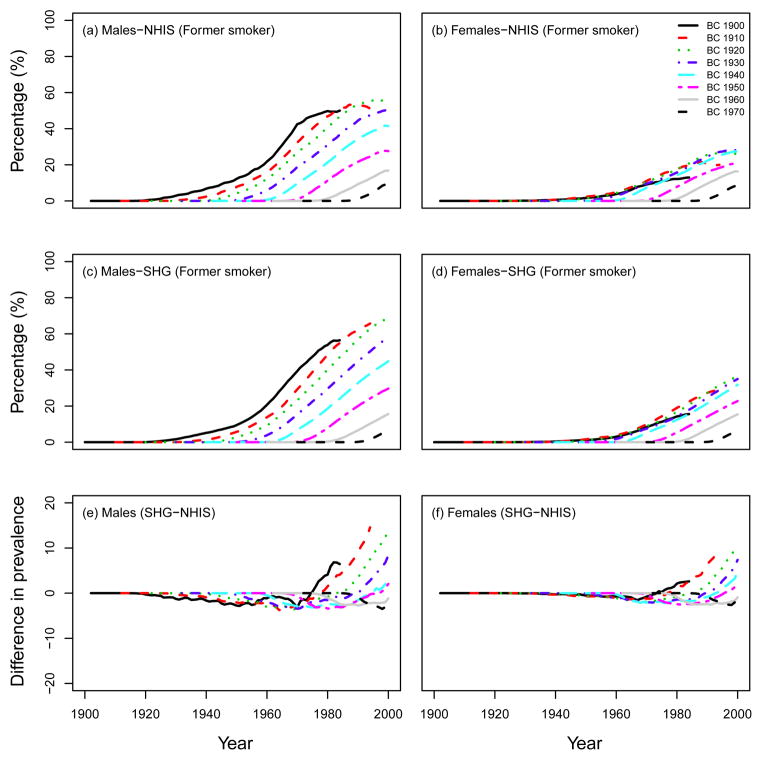
Percentage of former smokers in US males and females. Top row: observed data from the NHIS survey, middle row: computed prevalence using the SHG-generated data, adjusted for lung cancer deaths (ATC scenario). Bottom row: Difference between SHG-generated prevalence (SHG) and observed prevalence (NHIS), calculated by SHG-NHIS. BC=birth cohort.
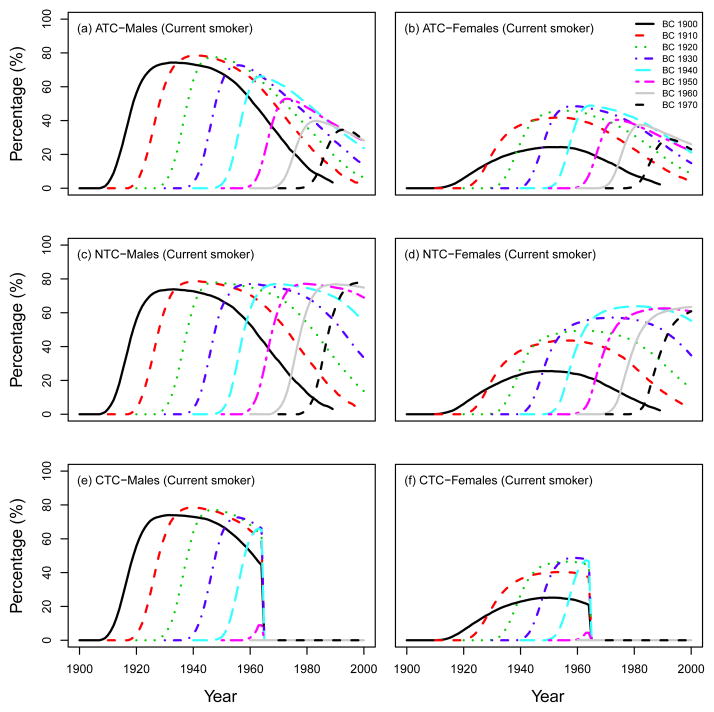
Prevalence of current smokers in US males and females in several birth cohorts, which were computed using the SHG-generated data, adjusted for lung cancer deaths. Three CISNET smoking scenarios; ATC: actual tobacco control, NTC: no tobacco control, CTC: complete tobacco control.
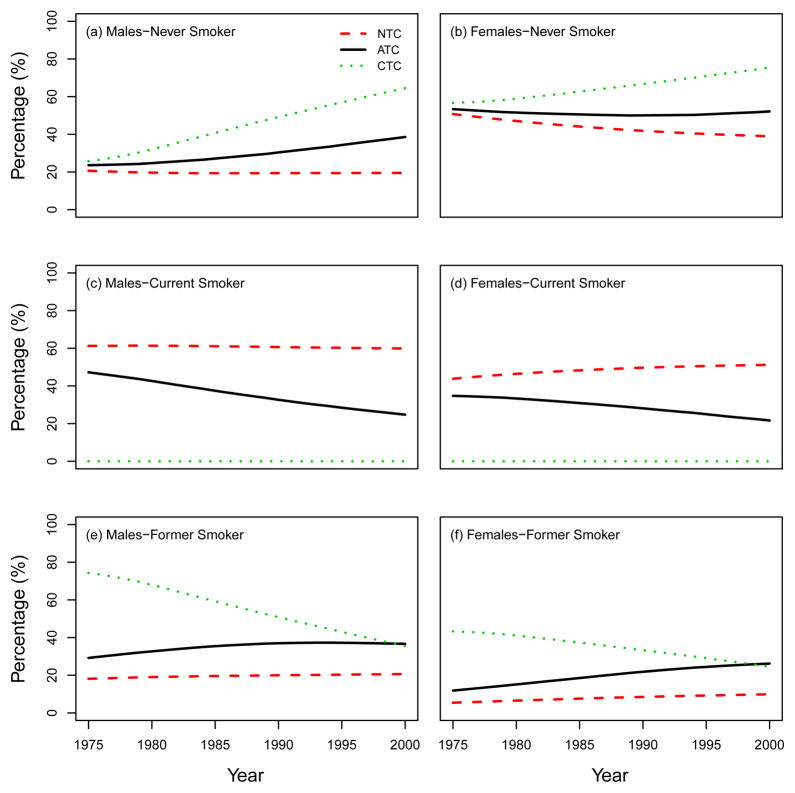
Percentage of never, current, and former smokers under the three CISNET smoking scenarios; NTC: no tobacco control, ATC: actual tobacco control, CTC: complete tobacco control. All the results are confined to ages 30–84 by following the same structure as the CISNET Lung Smoking Base Case.
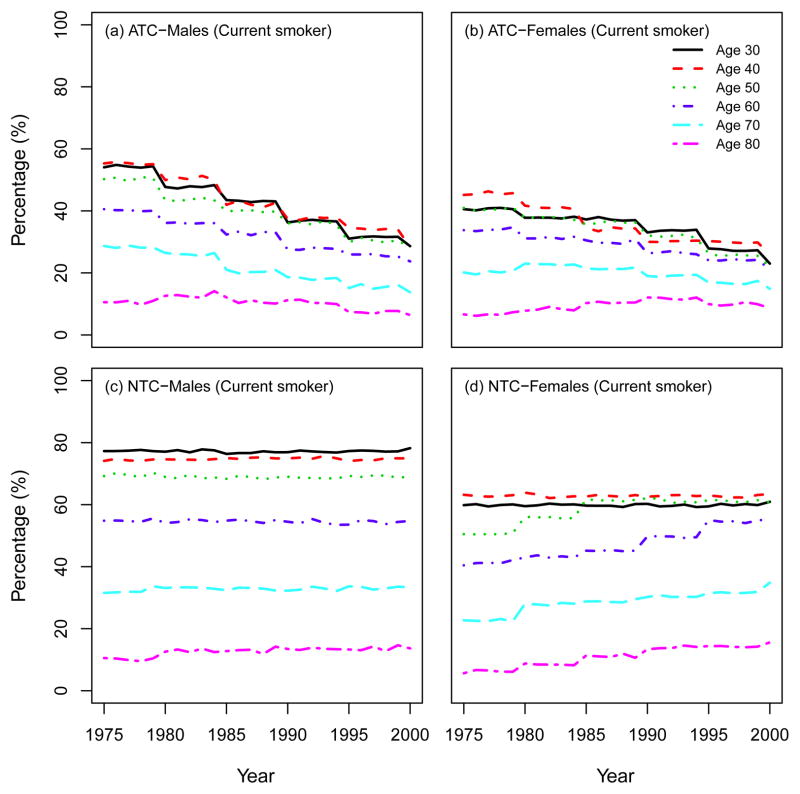
Prevalence of current smokers according to single ages (30; 40; 50; 60; 70; 80). ATC: actual tobacco control, NTC: no tobacco control.
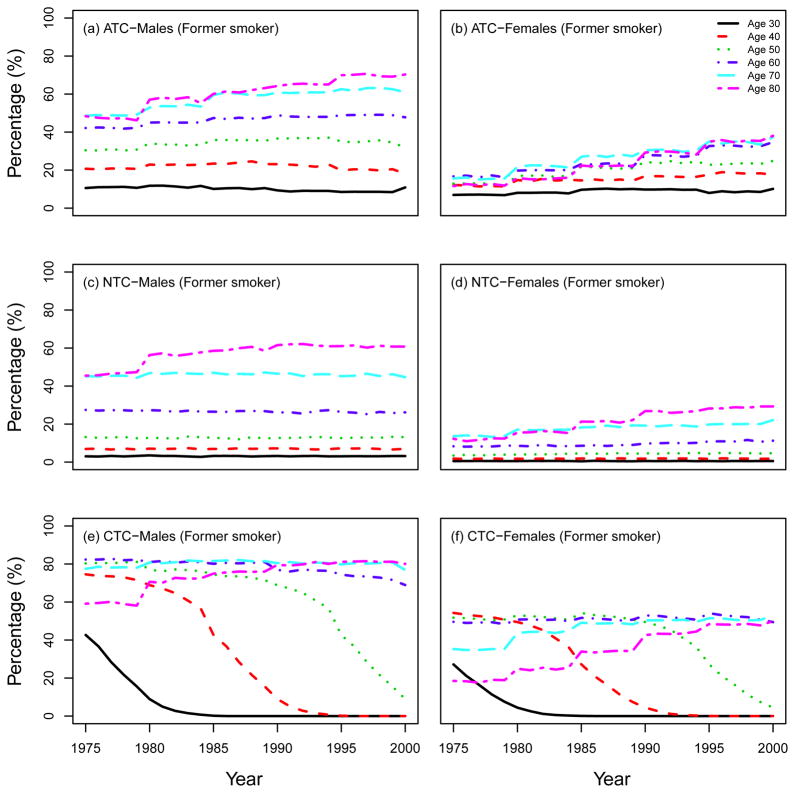
Prevalence of former smokers according to single ages (30; 40; 50; 60; 70; 80). ATC: actual tobacco control, NTC: no tobacco control, CTC: complete tobacco control.
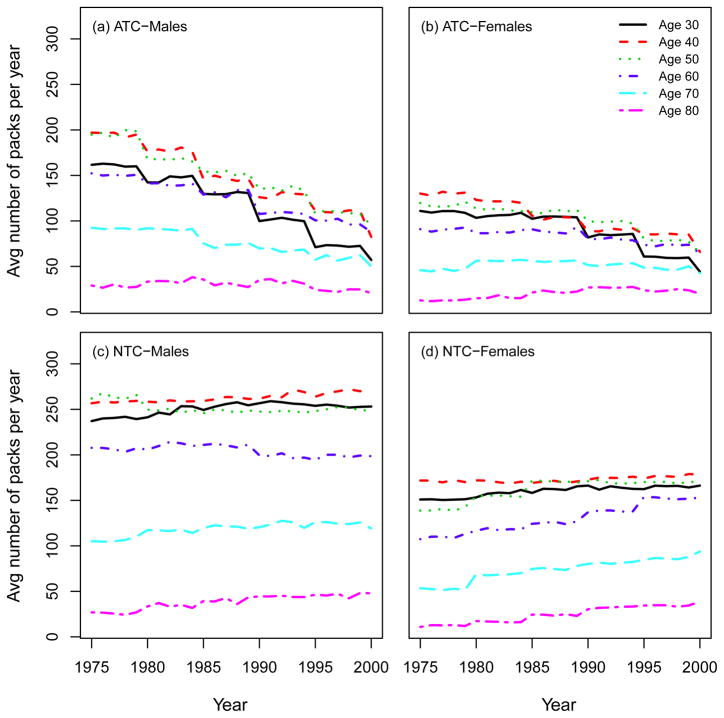
Average number of packs of cigarettes smoked per year according to single ages (30; 40; 50; 60; 70; 80). ATC: actual tobacco control, NTC: no tobacco control.
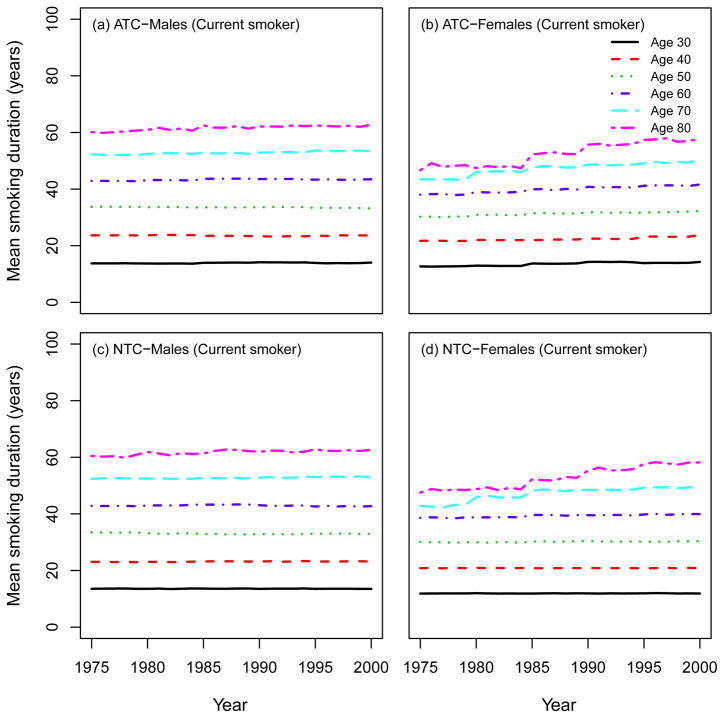
Mean smoking duration of current smokers according to single ages (30; 40; 50; 60; 70; 80). ATC: actual tobacco control, NTC: no tobacco control.
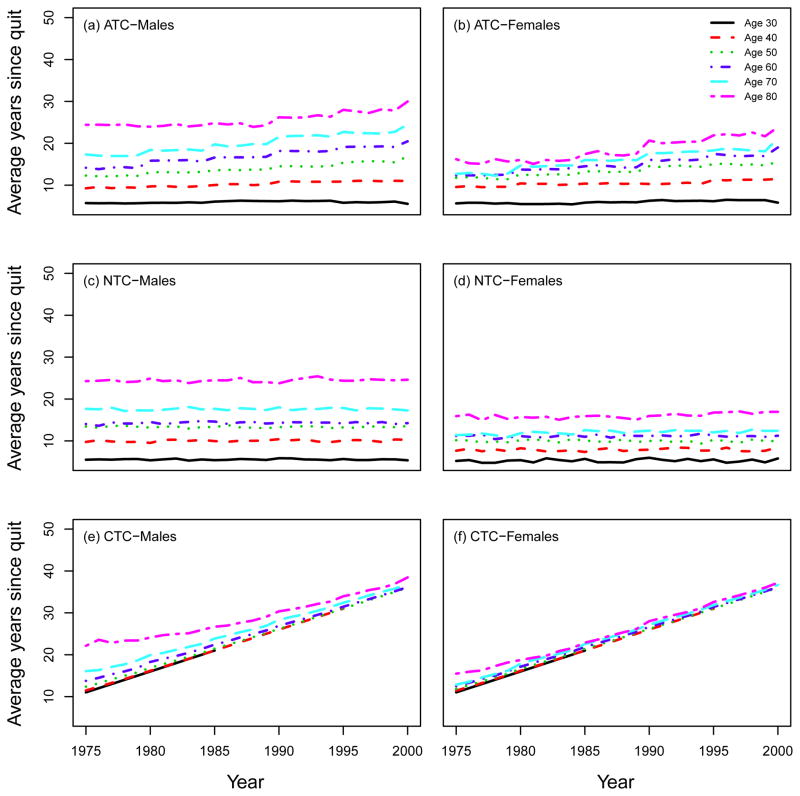
Average years since quitting smoking of former smokers according to single ages (30; 40; 50; 60; 70; 80). ATC: actual tobacco control, NTC: no tobacco control, CTC: complete tobacco control.
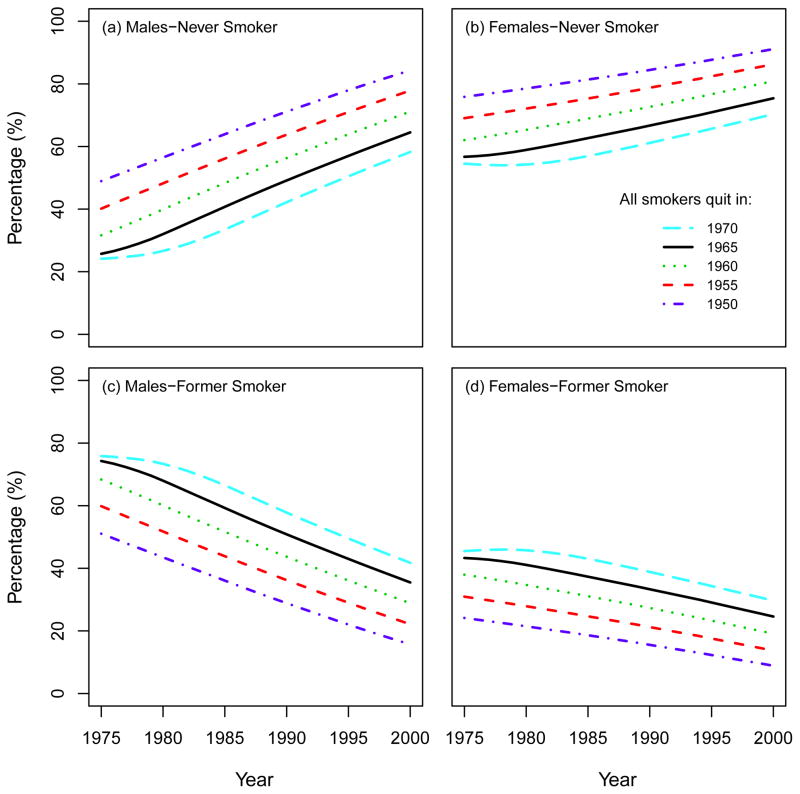
Percentage of never and former smokers under the CTC scenario by varying the year to quit smoking. All the results are confined to ages 30–84 by following the same structure as the CISNET Lung Smoking Base Case.
References
-
- Moolgavkar SH, Knudson AG., Jr Mutation and cancer: a model for human carcinogenesis. Journal of the National Cancer Institute. 1981;66(6):1037–1052. - PubMed
-
- Hazelton WD, Clements MS, Moolgavkar SH. Multistage carcinogenesis and lung cancer mortality in three cohorts. Cancer epidemiology, biomarkers & prevention. 2005;14(5):1171–1181. - PubMed
-
- Meza R, Hazelton WD, Colditz GA, Moolgavkar SH. Analysis of lung cancer incidence in the Nurses’ Health and the Health Professionals’ Follow-Up Studies using a multistage carcino-genesis model. Cancer causes & control. 2008;19(3):317–328. - PubMed
Publication types
MeSH terms
Grants and funding
LinkOut - more resources
Full Text Sources
Medical
Research Materials
