. 2012 Aug 10;91(2):275-92.
doi: 10.1016/j.ajhg.2012.06.014.

Genomic patterns of homozygosity in worldwide human populations

Affiliations

Genomic patterns of homozygosity in worldwide human populations

Trevor J Pemberton et al. Am J Hum Genet. .

Abstract

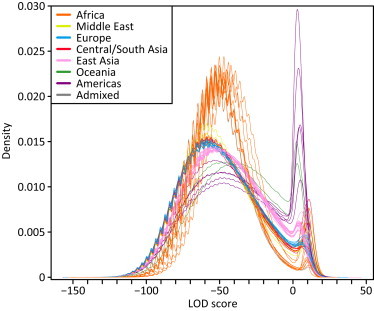
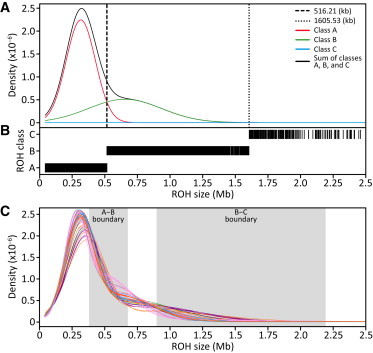
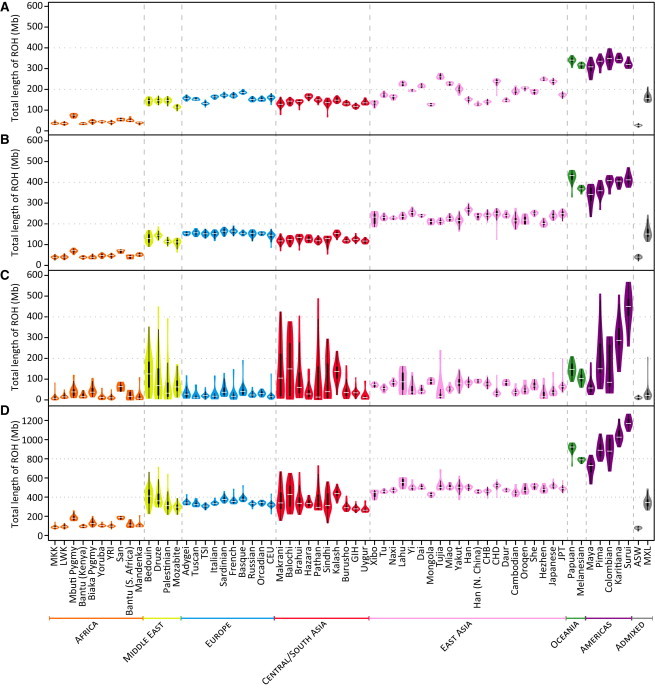
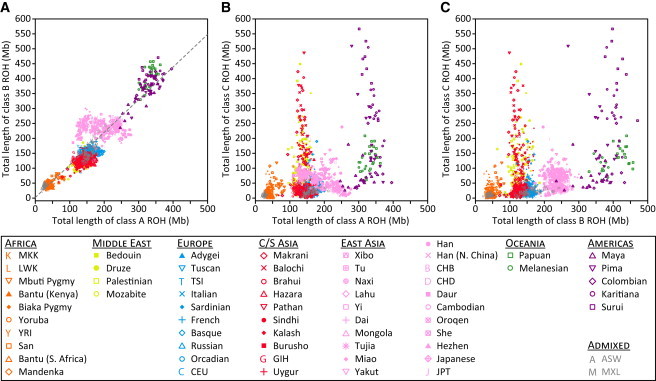
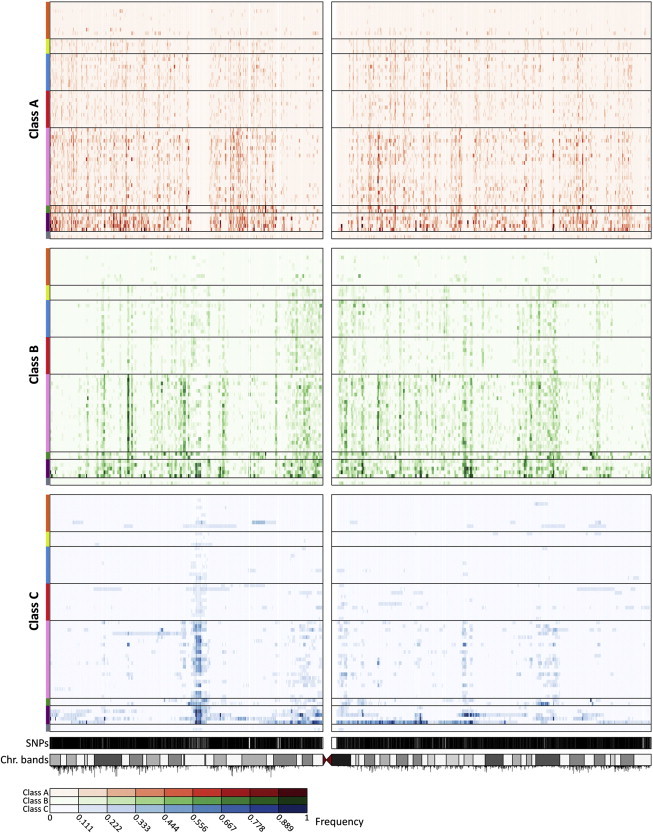
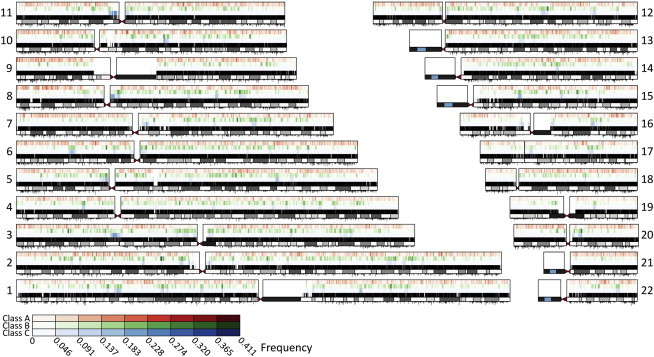
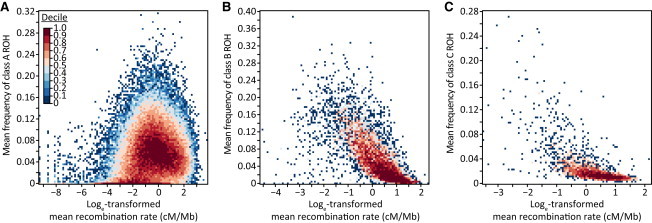
Genome-wide patterns of homozygosity runs and their variation across individuals provide a valuable and often untapped resource for studying human genetic diversity and evolutionary history. Using genotype data at 577,489 autosomal SNPs, we employed a likelihood-based approach to identify runs of homozygosity (ROH) in 1,839 individuals representing 64 worldwide populations, classifying them by length into three classes-short, intermediate, and long-with a model-based clustering algorithm. For each class, the number and total length of ROH per individual show considerable variation across individuals and populations. The total lengths of short and intermediate ROH per individual increase with the distance of a population from East Africa, in agreement with similar patterns previously observed for locus-wise homozygosity and linkage disequilibrium. By contrast, total lengths of long ROH show large interindividual variations that probably reflect recent inbreeding patterns, with higher values occurring more often in populations with known high frequencies of consanguineous unions. Across the genome, distributions of ROH are not uniform, and they have distinctive continental patterns. ROH frequencies across the genome are correlated with local genomic variables such as recombination rate, as well as with signals of recent positive selection. In addition, long ROH are more frequent in genomic regions harboring genes associated with autosomal-dominant diseases than in regions not implicated in Mendelian diseases. These results provide insight into the way in which homozygosity patterns are produced, and they generate baseline homozygosity patterns that can be used to aid homozygosity mapping of genes associated with recessive diseases.


Figures

Figure 1
Figure 1
LOD-Score Distributions in 64 Populations Each line represents the Gaussian kernel density estimates of the pooled LOD scores from all individuals in a given population, colored by geographic affiliation. The ASW and MXL admixed populations appear in gray. The periodicity of each density is a consequence of the resampling approach used to estimate allele frequencies.
Figure 2
Figure 2
Classification of ROH into Three Size Classes (A) An example Gaussian kernel density estimation of the ROH size distribution in a single population (French), with the boundary between ROH classes A and B marked by the vertical dashed line (0.516 Mb) and the boundary between classes B and C marked by the vertical dotted line (1.606 Mb). (B) Inferred assignment of ROH into the three classes for the French population. Only ROH less than 2.5 Mb in length are shown. However, all ROH, regardless of length, were used in the analysis. (C) Gaussian kernel density estimates of the ROH size distribution in each of the 64 populations, where each line represents a different population, colored by geographic affiliation (Figure 1). The size ranges across the 64 populations of the boundaries between ROH classes A and B and between classes B and C are shown by the shaded boxes.
Figure 3
Figure 3
Population-Specific Distributions of the Total Length of ROH per Individual Data are shown as “violin plots,” representing the distribution of total ROH length over all individuals in each of the 53 HGDP-CEPH and 11 HapMap populations, for (A) class A, (B) class B, (C) class C, and (D) all three classes combined. Each “violin” contains a vertical black line (25%–75% range) and a horizontal white line (median), with the width depicting a 90°-rotated kernel density trace and its reflection, both colored by the geographic affiliation of the population. Populations are ordered from left to right by geographic region and within each region by increasing geographic distance from Addis Ababa.
Figure 4
Figure 4
Comparison of per-Individual Total ROH Lengths across Size Classes (A) Class B versus class A (r = 0.899, p < 10−16). (B) Class C versus class A (r = 0.381, p < 10−16). (C) Class C versus class B (r = 0.410, p < 10−16).
Figure 5
Figure 5
Distribution of ROH Frequency across Chromosome 3 for Each ROH Class For each ROH class, for each population, at each SNP, the proportion of individuals in that population who have an ROH encompassing the SNP is plotted. Each row represents a population, and each column represents a genotyped SNP position. The intensity of a point increases with increasing ROH frequency, as indicated by the color scale below the figure. Populations are ordered from top to bottom by geographic affiliation, as indicated by colored bars on the left, and within regions from top to bottom by increasing geographic distance from Addis Ababa (in the same order as in Figure 3). SNP positions and the ideogram of chromosome banding are in the bottom tracks. Recombination rates are represented by vertical black lines below the ideogram, with line heights proportional to recombination rates.
Figure 6
Figure 6
Geographic Groupings in the Distribution of ROH Frequencies across the Genome The first two dimensions of a multidimensional scaling analysis of pairwise correlations between genome-wide ROH frequencies in individual populations are shown for: (A) class A, (B) class B, and (C) class C ROH. Populations are indicated by the same symbols as in Figure 4.
Figure 7
Figure 7
Distribution of Worldwide Mean ROH Frequency across the Genome For each chromosome, the figure shows the ROH frequency for class A (top), class B (middle), and class C (bottom). SNP position, chromosome banding, and recombination rates are shown as in Figure 5.
Figure 8
Figure 8
Relationship between ROH Frequency and Recombination Rate across the Genome The figure shows heat maps for (A) class A (ρ = 0.171, p < 10−16), (B) class B (ρ = −0.785, p < 10−16), and (C) class C (ρ = −0.731, p < 10−16). Cells are colored by decile. The numbers of data points (nonoverlapping genomic windows) examined are 75,282, 7,013, and 2,994 for classes A, B, and C, respectively.
Figure 9
Figure 9
Relationship between iHS Selection Scores and ROH Frequencies in the 53 HGDP-CEPH Populations The decrease of the Spearman’s partial rank correlation (ρpc) between iHS and ROH frequency with geographic distance from Addis Ababa is shown for (A) class A (R2 = 0.468), (B) class B (R2 = 0.253), and (C) class C (R2 = 0.001) ROH. Populations are indicated by the same symbols as in Figure 4. Most ρpc correlations had p < 0.05 (exceptions: A, Naxi and Surui; B, Papuan).

Similar articles

Cited by

References

    1. Darwin C.R. John Murray; London, UK: 1876. The effects of cross and self fertilization in the vegetable kingdom.
    1. Garrod A.E. The incidence of alkaptonuria: a study in chemical individuality. Lancet. 1902;160:1616–1620.
    1. Mendel, G. (1866). Versuche über Pflanzenhybriden. Verhandlungen des naturforschenden Vereines in Brünn, 4, 3–47.
    1. Li L.H., Ho S.F., Chen C.H., Wei C.Y., Wong W.C., Li L.Y., Hung S.I., Chung W.H., Pan W.H., Lee M.T. Long contiguous stretches of homozygosity in the human genome. Hum. Mutat. 2006;27:1115–1121. - PubMed
    1. Jakkula E., Rehnström K., Varilo T., Pietiläinen O.P., Paunio T., Pedersen N.L., deFaire U., Järvelin M.R., Saharinen J., Freimer N. The genome-wide patterns of variation expose significant substructure in a founder population. Am. J. Hum. Genet. 2008;83:787–794. - PMC - PubMed

Publication types

LinkOut - more resources