. 2012 Aug 8;16(2):226-37.
doi: 10.1016/j.cmet.2012.07.006.

O-GlcNAc transferase/host cell factor C1 complex regulates gluconeogenesis by modulating PGC-1α stability

Affiliations

O-GlcNAc transferase/host cell factor C1 complex regulates gluconeogenesis by modulating PGC-1α stability

Hai-Bin Ruan et al. Cell Metab. .

Abstract

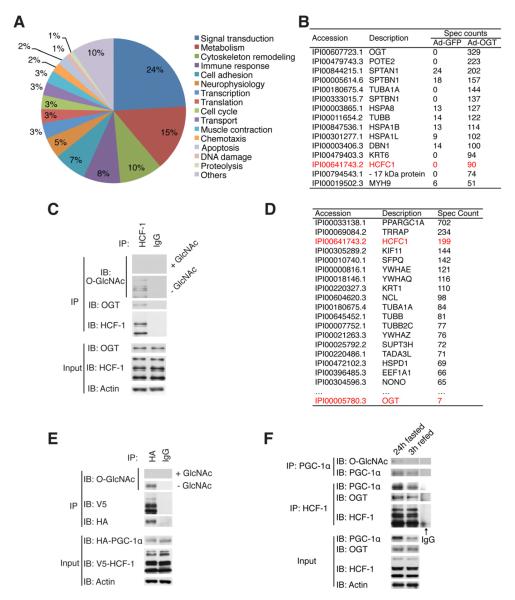
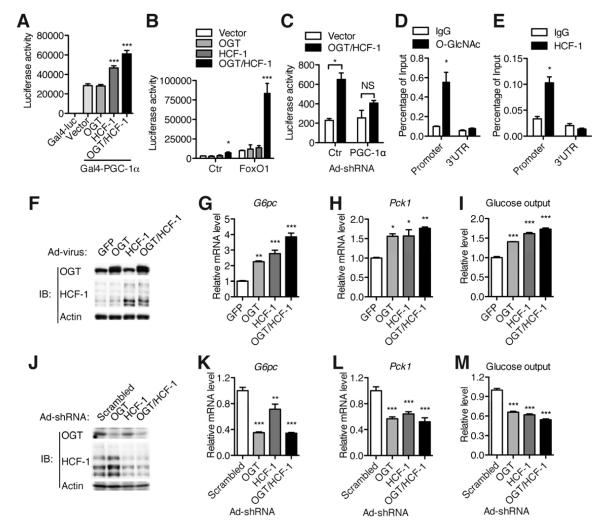
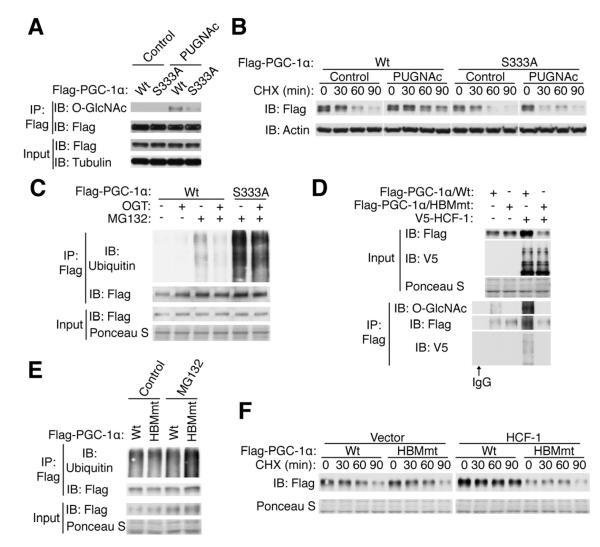
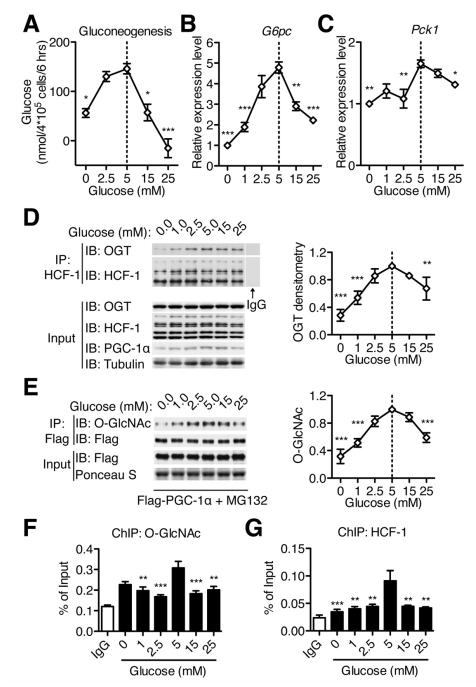
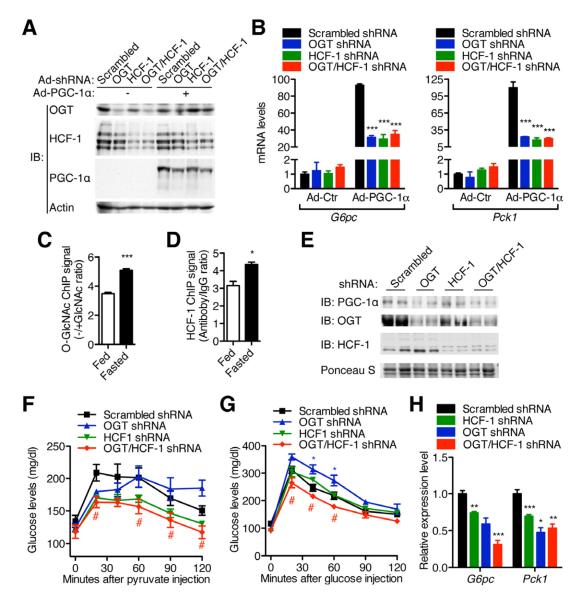
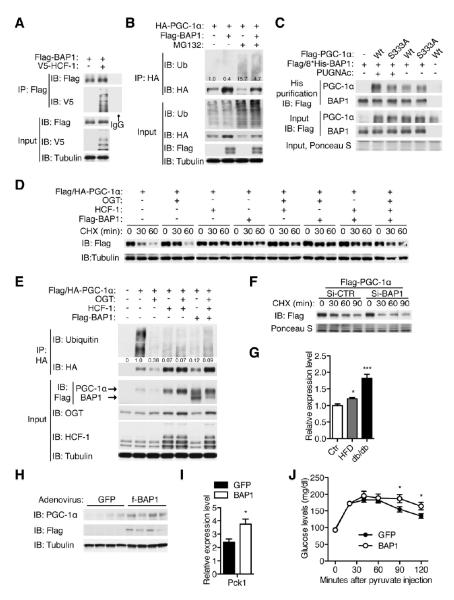
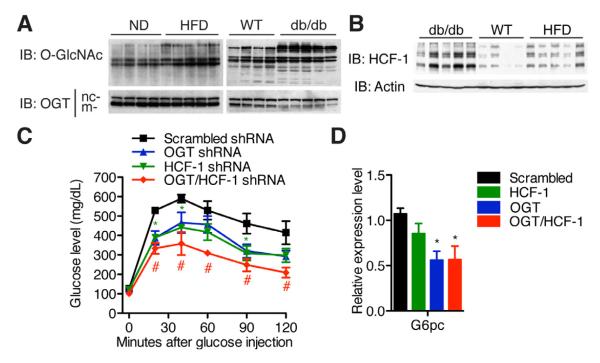
A major cause of hyperglycemia in diabetic patients is inappropriate hepatic gluconeogenesis. PGC-1α is a master regulator of gluconeogenesis, and its activity is controlled by various posttranslational modifications. A small portion of glucose metabolizes through the hexosamine biosynthetic pathway, which leads to O-linked β-N-acetylglucosamine (O-GlcNAc) modification of cytoplasmic and nuclear proteins. Using a proteomic approach, we identified a broad variety of proteins associated with O-GlcNAc transferase (OGT), among which host cell factor C1 (HCF-1) is highly abundant. HCF-1 recruits OGT to O-GlcNAcylate PGC-1α, and O-GlcNAcylation facilitates the binding of the deubiquitinase BAP1, thus protecting PGC-1α from degradation and promoting gluconeogenesis. Glucose availability modulates gluconeogenesis through the regulation of PGC-1α O-GlcNAcylation and stability by the OGT/HCF-1 complex. Hepatic knockdown of OGT and HCF-1 improves glucose homeostasis in diabetic mice. These findings define the OGT/HCF-1 complex as a glucose sensor and key regulator of gluconeogenesis, shedding light on new strategies for treating diabetes.


Figures

Figure 1
Figure 1. Identification of OGT/HCF-1/PGC-1α protein complex
(A) Pie chart of functional distribution of identified putative OGT-binding proteins. (B) The top of the list of putative OGT-binding proteins. Spectrum counts in GFP and OGT samples were shown. (C) The interaction between OGT and HCF-1 was confirmed by co-immunoprecipitation of endogenous proteins from hepatoma FAO cells. 0.1 M of free GlcNAc was added to control the specificity of O-GlcNAc antibody. (D) List of top proteins identified in PGC-1α complex purification. (E) HEK 293T cells were co-transfected with HA-tagged PGC-1α and V5-tagged HCF-1, and their interaction and PGC-1α O-GlcNAcylation were determined. (F) Interactions of HCF-1 with OGT and PGC-1α (middle) and the O-GlcNAcylation of PGC-1α (top) in the livers from 24h fasted and 3h refed mice are shown.
Figure 2
Figure 2. OGT and HCF-1 cooperatively up-regulate gluconeogenesis
(A, B) Luciferase assays were performed in HepG2 cells; luciferase activity was normalized to co-transfected β-Gal activity. (A) Gal4-PGC-1α transactivation assay (n = 3), (B) G6pc-luciferase assay in the absence or presence of FOXO1 (n = 3). (C) G6pc-luciferase assay following infection of FOXO1-transfected FAO cells with adenovirus encoding PGC-1α shRNA or scrambled control shRNA (n = 3). (D, E) Chromatin immunoprecipitation assays of primary hepatocytes using O-GlcANc (D) and HCF-1 (E) antibodies (n = 3). IgG served as a negative control. Real time PCR was performed with primers flanking FOXO1/HNF4α binding region or 3′UTR (a negative control) of the G6pc gene. (F-M) FAO cells were infected with overexpression (F-I) or knockdown (J-M) adenoviruses as indicated, then protein expression (F, J), G6pc (G, K) and Pck1 (H, L) gene expression and glucose output (I, M) were determined (n = 3). All values represent mean ± SEM of data from three independent experiments. *, P < 0.05 **, P < 0.01; ***, P < 0.001 by ANOVA with a Bonferroni’s post hoc test compared with the vector control (A-B, G-I, K-M). *, P < 0.05 by student’s t-test (C-E).
Figure 3
Figure 3. O-GlcNAcylation and HCF-1 stabilize PGC1α
HEK 293T cells were transfected and treated as indicated. (A) O-GlcNAcylation of Wt and S333A mutant PGC-1α. (B) Stability of PGC-1α was determined by treatment of cycloheximide (CHX), an inhibitor of protein synthesis. Relative half-lives are shown in Figure S3D. (C) Ubiquitination of Wt and S333A PGC-1α treated with proteasome inhibitor MG132. (D) O-GlcNAcylation and HCF-1 interaction of PGC-1αHBMmt protein. (E) Ubiquitination of PGC-1αHBMmt protein. (F) Stability of Wt and HBMmt PGC-1α in the presence or absence of HCF-1. Relative half-lives are shown in Figure S3G.
Figure 4
Figure 4. Glucose availability regulates gluconeogenesis and OGT/HCF-1 complex
(A) Primary hepatocytes from 24h fasted mice were treated with gluconeogenic medium containing 13C pyruvate, lactate and different levels of glucose. Newly synthesized glucose was calculated based on the distribution of glucose M+1 isotopomers (n = 3). (B-C) FAO cells were treated with medium containing different levels of glucose for 6 hours, and G6pc (B) and Pck1 (C) transcripts were determined by real time PCR (n = 3). (D) Immunoprecipitation of endogenous HCF-1 from protein lysates of FAO cells treated with different levels of glucose. Relative recovery of OGT in HCF-1 immunoprecipitation is shown at right. (E) FAO cells were infected with Flag/HA-PGC-1α adenovirus. MG132 was added during the glucose treatment to equalize PGC-1α expression. O-GlcNAcylation levels of PGC-1α were determined, with the densitometric values shown at right (n = 3). (F, G) Primary hepatocytes were treated with different levels of glucose for 6 h, and the association of O-GlcNAc (F) and HCF-1 (G) on the G6pc promoter was determined by chromatin immunoprecipitation (n = 3). All values represent mean ± SEM of data from three independent experiments. *, P < 0.05; **, P < 0.01; ***, P < 0.001 by ANOVA with a Bonferroni’s post hoc test compared with 5 mM glucose.
Figure 5
Figure 5. OGT/HCF-1 regulates gluconeogenesis in a PGC-1α dependent way
(A-B) Primary hepatocytes from fed C57BL/6 mice (n = 3) were infected with adenoviruses indicated. (A) Protein and (B) mRNA levels were determined by Western blotting and real time PCR, respectively. (C-D) Chromatin immunoprecipitation of (C) O-GlcNAc and (D) HCF-1 on the G6pc promoter from primary hepatocytes of fed or fasted mice. Antibody plus 0.1M free GlcNAc (C) and rabbit IgG (D) were served as negative controls, respectively. The relative signal to the control is shown. (E-H) 12-week-old C57BL/6 male mice (n = 4-6) were injected with shRNA adenoviruses through tail vein. Protein expression (E, day 3), pyruvate tolerance test (F, day 3), glucose tolerance test (G, day 5) and gluconeogenic gene expression (H, day 7) were determined. *, #, P < 0.05; **, P < 0.01; ***, P < 0.001 by ANOVA with a Bonferroni’s post hoc test compared with scrambled shRNA. All values represent mean ± SEM.
Figure 6
Figure 6. O-GlcNAcylation and HCF-1 recruits BAP1 to deubiquitinate PGC-1α
(A-F) HEK 293T cells were transfected and treated as indicated. (A) BAP1 interacts with HCF-1. (B) Ubiquitination of PGC-1α was determined with/without BAP1 overexpression. Relative ubiquitination normalized to the protein level is shown. (C) Interaction between PGC-1α and BAP1 was examined by checking recovery of PGC-1α from metal affinity purification of His-tagged BAP1. (D) Stability and (E) ubiquitination of PGC-1α are shown when co-transfected with OGT, HCF-1 and BAP1. Relative ubiquitination normalized to protein level is shown. (F) Stability of PGC-1α in response to BAP1 knockdown. Knockdown efficiency is shown in Figure S6A. (G) BAP1 gene expression in HFD and db/db mice compared to age-matched wildtype mice revealed by real time PCR (n = 4-5). (H-J) 12-week-old C57BL/6 male mice (n = 4) were injected with GFP or f-BAP1 adenoviruses through tail vein. Protein expression (H, day 5), Pck1 gene expression (I, day 5) and pyruvate tolerance test (J, day 3) were determined. (G, I) *, P < 0.05; ***, P < 0.001 by two-tailed t-test. (J) *, P < 0.05 by ANOVA with a Bonferroni’s post hoc test compared with the control. All values represent mean ± SEM.
Figure 7
Figure 7. Hepatic knockdown of OGT and HCF-1 improves glucose homeostasis in diabetic mice
(A) Global O-GlcNAcylation level and OGT expression and (B) HCF-1 protein expression in livers of age-matched C57Bl/6 mice on normal diet (WT and ND), on high fat diet (HFD) and db/db mice (n = 4-5). nc- and m-refer to nucleocytoplasmic and mitochondrial forms of OGT, respectively. Densitometric analysis is shown in Figure S7 C-E. (C, D) 12-week-old db/db male mice (n = 4-6) were infected with shRNA adenoviruses. (C) Glucose tolerance test (day 3). (D) G6pc mRNA expression in liver (day 7). *, #, P < 0.05; **, P < 0.01 by ANOVA with a Bonferroni’s post hoc test compared with scrambled shRNA. All values represent mean ± SEM.

Similar articles

Cited by

References

    1. Andrali SS, Qian Q, Ozcan S. Glucose mediates the translocation of NeuroD1 by O-linked glycosylation. J Biol Chem. 2007;282:15589–15596. - PMC - PubMed
    1. Butkinaree C, Park K, Hart GW. O-linked beta-N-acetylglucosamine (O-GlcNAc): Extensive crosstalk with phosphorylation to regulate signaling and transcription in response to nutrients and stress. Biochim Biophys Acta. 2010;1800:96–106. - PMC - PubMed
    1. Capotosti F, Guernier S, Lammers F, Waridel P, Cai Y, Jin J, Conaway JW, Conaway RC, Herr W. O-GlcNAc Transferase Catalyzes Site-Specific Proteolysis of HCF-1. Cell. 2011;144:376–388. - PubMed
    1. Cheung WD, Hart GW. AMP-activated protein kinase and p38 MAPK activate O-GlcNAcylation of neuronal proteins during glucose deprivation. J Biol Chem. 2008;283:13009–13020. - PMC - PubMed
    1. Chikanishi T, Fujiki R, Hashiba W, Sekine H, Yokoyama A, Kato S. Glucose-induced expression of MIP-1 genes requires O-GlcNAc transferase in monocytes. Biochem Biophys Res Commun. 2010;394:865–870. - PubMed

Publication types

MeSH terms

Substances