

Disentangling linear and nonlinear brain responses to evoked deep tissue pain
- PMID: 22883925
- PMCID: PMC3445769
- DOI: 10.1016/j.pain.2012.07.014
Disentangling linear and nonlinear brain responses to evoked deep tissue pain
Abstract
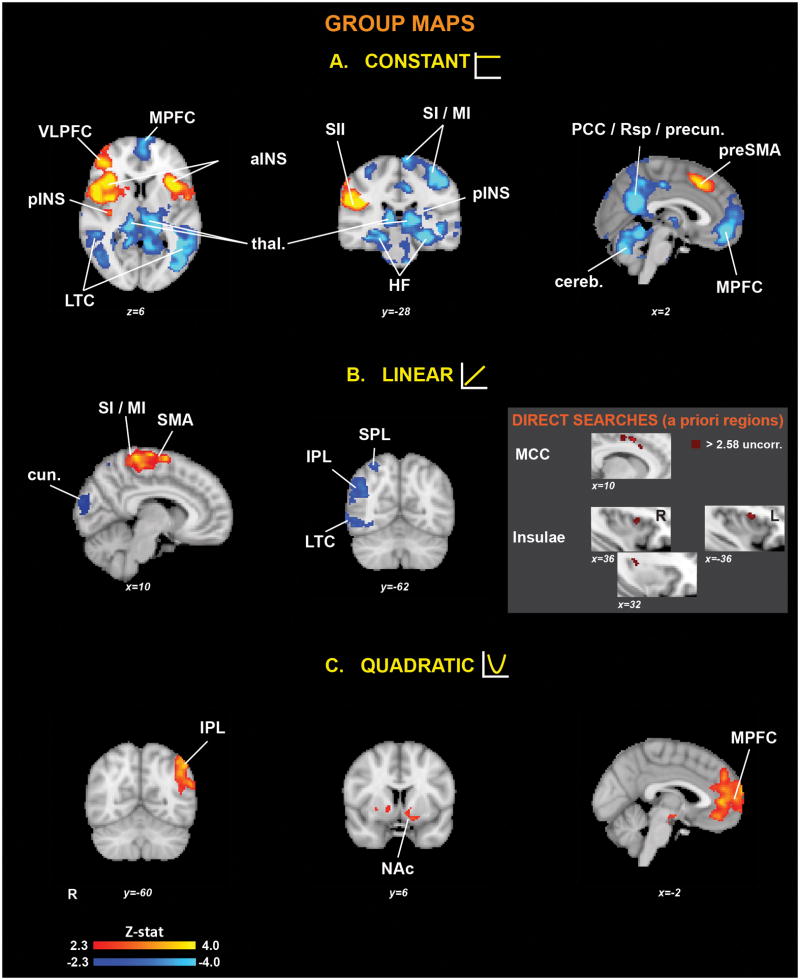
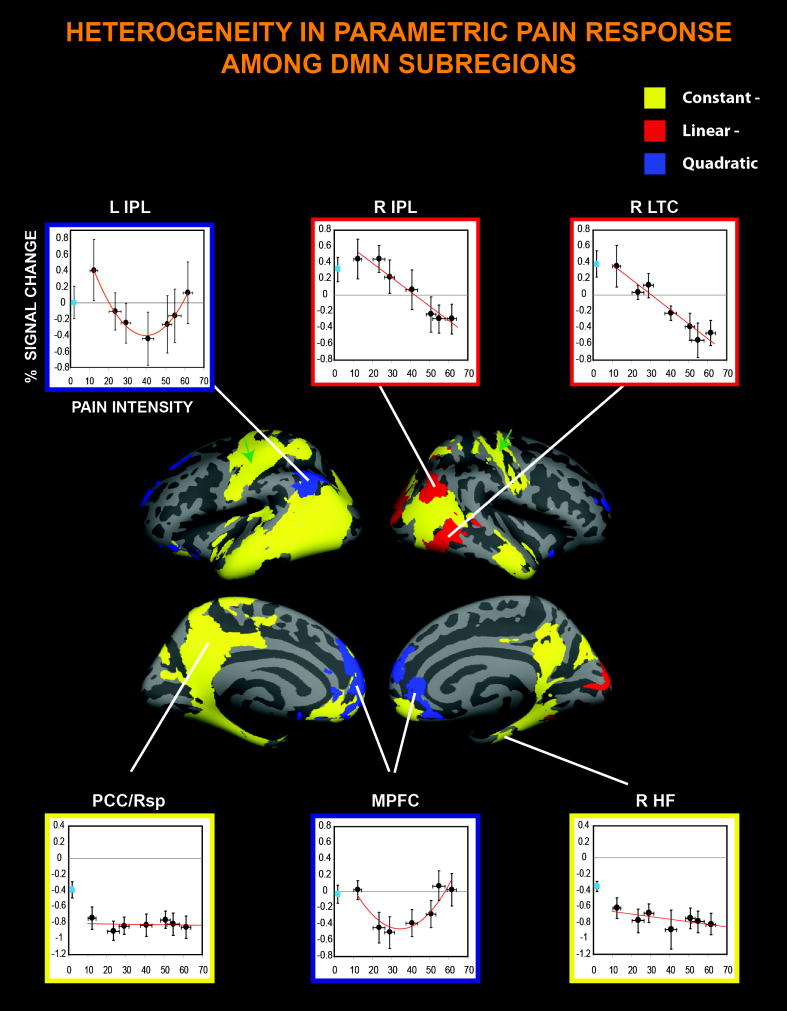
Pain stimuli evoke widespread responses in the brain. However, our understanding of the physiological significance underlying heterogeneous response within different pain-activated and -deactivated regions is still limited. Using functional magnetic resonance imaging, we evaluated brain responses to a wide range of stimulus intensity levels (1 innocuous, 7 painful) in order to estimate region-specific stimulus-response functions, which we hypothesized could illuminate that region's functional relationship to pain. Linear and nonlinear brain responses to pain were estimated through independent Legendre polynomial transformations of pain ratings within a general linear model. This approach identified at least 5 different, regionally specific activity profiles in the brain. Linearly increasing (eg, primary somatosensory/motor cortex, insulae) and intensity-independent (eg, secondary somatosensory cortex) activation was noted in traditional pain-processing areas, potentially reflecting sensory encoding and all-or-none salience responses, respectively. Multiple activity profiles were seen in areas of the default mode network (DMN): intensity-independent deactivation (eg, posterior cingulate cortex), linearly decreasing (eg, contralateral inferior parietal lobule), and quadratic (U-shaped; eg, medial prefrontal cortex). The latter observation suggests that: (1) different DMN subregions exhibit functional heterogeneity and (2) some DMN subregions respond in a percept-related manner to pain, suggesting closer linkage between the DMN and pain processing than previously thought. Future studies should apply a similar approach using innocuous stimuli of multiple intensities to evaluate whether the response profiles reported here can also be generalized to nonpainful somatosensory processing.
Copyright © 2012 International Association for the Study of Pain. Published by Elsevier B.V. All rights reserved.
Conflict of interest statement
The authors have no conflicts of interest to declare.
Figures


Similar articles
-
BOLD responses in somatosensory cortices better reflect heat sensation than pain.J Neurosci. 2012 Apr 25;32(17):6024-31. doi: 10.1523/JNEUROSCI.0006-12.2012. J Neurosci. 2012. PMID: 22539862 Free PMC article.
-
Amplified Brain Processing of Dentoalveolar Pressure Stimulus in Persistent Dentoalveolar Pain Disorder Patients.J Oral Facial Pain Headache. 2015 Fall;29(4):349-62. doi: 10.11607/ofph.1463. J Oral Facial Pain Headache. 2015. PMID: 26485382 Free PMC article.
-
Functional imaging of brain responses to pain. A review and meta-analysis (2000).Neurophysiol Clin. 2000 Oct;30(5):263-88. doi: 10.1016/s0987-7053(00)00227-6. Neurophysiol Clin. 2000. PMID: 11126640 Review.
-
Hemispheric lateralization of somatosensory processing.J Neurophysiol. 2001 Jun;85(6):2602-12. doi: 10.1152/jn.2001.85.6.2602. J Neurophysiol. 2001. PMID: 11387404
-
Pain and the Triple Network Model.Front Neurol. 2022 Mar 7;13:757241. doi: 10.3389/fneur.2022.757241. eCollection 2022. Front Neurol. 2022. PMID: 35321511 Free PMC article. Review.
Cited by
-
Sustained deep-tissue pain alters functional brain connectivity.Pain. 2013 Aug;154(8):1343-51. doi: 10.1016/j.pain.2013.04.016. Epub 2013 Apr 11. Pain. 2013. PMID: 23718988 Free PMC article.
-
Prior exposure to extreme pain alters neural response to pain in others.Cogn Affect Behav Neurosci. 2016 Aug;16(4):662-71. doi: 10.3758/s13415-016-0422-7. Cogn Affect Behav Neurosci. 2016. PMID: 27032959
-
The lateral prefrontal cortex mediates the hyperalgesic effects of negative cognitions in chronic pain patients.J Pain. 2015 Aug;16(8):692-9. doi: 10.1016/j.jpain.2015.04.003. Epub 2015 Apr 30. J Pain. 2015. PMID: 25937162 Free PMC article.
-
Mind wandering away from pain dynamically engages antinociceptive and default mode brain networks.Proc Natl Acad Sci U S A. 2013 Nov 12;110(46):18692-7. doi: 10.1073/pnas.1312902110. Epub 2013 Oct 28. Proc Natl Acad Sci U S A. 2013. PMID: 24167282 Free PMC article.
-
Unlearning chronic pain: A randomized controlled trial to investigate changes in intrinsic brain connectivity following Cognitive Behavioral Therapy.Neuroimage Clin. 2014 Jul 23;5:365-76. doi: 10.1016/j.nicl.2014.07.008. eCollection 2014. Neuroimage Clin. 2014. PMID: 26958466 Free PMC article. Clinical Trial.
References
-
- Apkarian AV, Bushnell MC, Treede RD, Zubieta JK. Human brain mechanisms of pain perception and regulation in health and disease. Eur J Pain. 2005;9(4):463–484. - PubMed
-
- Becerra L, Breiter HC, Wise R, Gonzalez RG, Borsook D. Reward circuitry activation by noxious thermal stimuli. Neuron. 2001;32(5):927–946. - PubMed
Publication types
MeSH terms
Grants and funding
- P41 RR014075/RR/NCRR NIH HHS/United States
- R01 AG034982/AG/NIA NIH HHS/United States
- K23 DA020681/DA/NIDA NIH HHS/United States
- UL1 RR025758/RR/NCRR NIH HHS/United States
- 1K23DA020681-01A1/DA/NIDA NIH HHS/United States
- K01-AT002166/AT/NCCIH NIH HHS/United States
- P01-AT002048/AT/NCCIH NIH HHS/United States
- K01 AT002166/AT/NCCIH NIH HHS/United States
- P01 AT002048/AT/NCCIH NIH HHS/United States
- F05 AT003770/AT/NCCIH NIH HHS/United States
- R01 AT004714/AT/NCCIH NIH HHS/United States
- R01-AT004714/AT/NCCIH NIH HHS/United States
- F05-AT003770/AT/NCCIH NIH HHS/United States
- P41RR14075/RR/NCRR NIH HHS/United States
- 1 UL1 RR025758/RR/NCRR NIH HHS/United States
LinkOut - more resources
Full Text Sources
Medical
