

Extracellular adenosine signaling induces CX3CL1 expression in the brain to promote experimental autoimmune encephalomyelitis
- PMID: 22883932
- PMCID: PMC3458968
- DOI: 10.1186/1742-2094-9-193
Extracellular adenosine signaling induces CX3CL1 expression in the brain to promote experimental autoimmune encephalomyelitis
Abstract
Background: Multiple sclerosis and its animal model experimental autoimmune encephalomyelitis (EAE) are debilitating neuroinflammatory diseases mediated by lymphocyte entry into the central nervous system (CNS). While it is not known what triggers lymphocyte entry into the CNS during neuroinflammation, blockade of lymphocyte migration has been shown to be effective in controlling neuroinflammatory diseases. Since we have previously shown that extracellular adenosine is a key mediator of lymphocyte migration into the CNS during EAE progression, we wanted to determine which factors are regulated by adenosine to modulate EAE development.
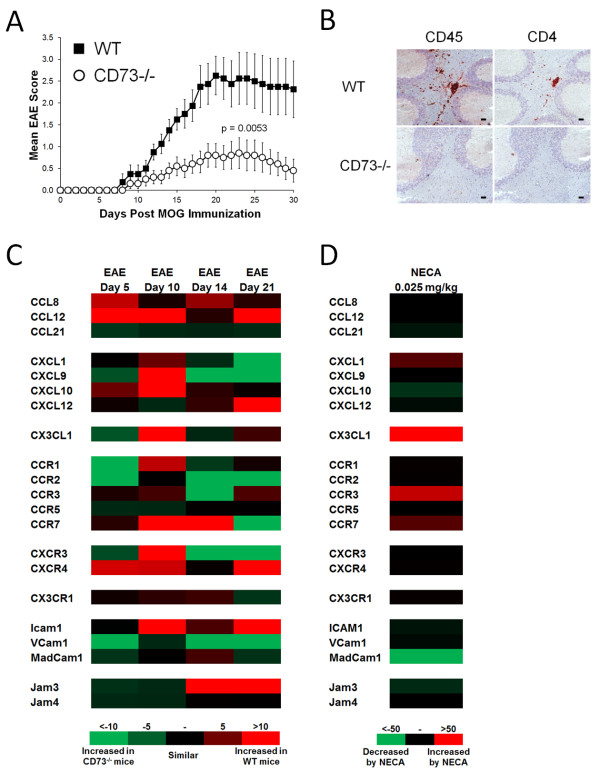
Methods: We performed a genetic analysis of wild type and CD73-/- (that are unable to produce extracellular adenosine and are protected from EAE development) to identify factors that are both important for EAE development and controlled by extracellular adenosine signaling.
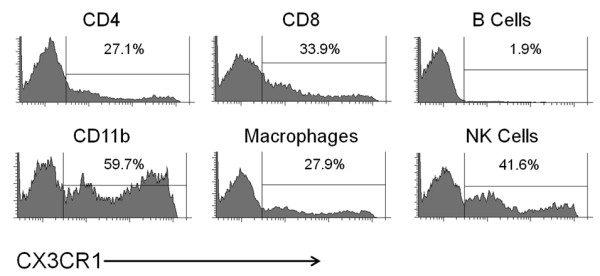
Results: We show that extracellular adenosine triggered lymphocyte migration into the CNS by inducing the expression of the specialized chemokine/adhesion molecule CX3CL1 at the choroid plexus. In wild type mice, CX3CL1 is upregulated in the brain on Day 10 post EAE induction, which corresponds with initial CNS lymphocyte infiltration and the acute stage of EAE. Conversely, mice that cannot synthesize extracellular adenosine (CD73-/- mice) do not upregulate CX3CL1 in the brain following EAE induction and are protected from EAE development and its associated lymphocyte infiltration. Additionally, blockade of the A2A adenosine receptor following EAE induction prevents disease development and the induction of brain CX3CL1 expression. The CX3CL1 induced during EAE is found on the choroid plexus, which is the barrier between the blood and cerebral spinal fluid in the brain and is a prime entry point into the CNS for immune cells. Furthermore, CX3CL1 expression can be induced in the brains of mice and in choroid plexus cell line following A2A adenosine receptor agonist administration. Most importantly, we show that CX3CL1 blockade protects against EAE development and inhibits lymphocyte entry into the CNS.
Conclusions: We conclude that extracellular adenosine is an endogenous modulator of neuroinflammation during EAE that induces CX3CL1 at the choroid plexus to trigger lymphocyte entry into the brain.
Figures


Similar articles
-
A2A adenosine receptor signaling in lymphocytes and the central nervous system regulates inflammation during experimental autoimmune encephalomyelitis.J Immunol. 2012 Jun 1;188(11):5713-22. doi: 10.4049/jimmunol.1200545. Epub 2012 Apr 23. J Immunol. 2012. PMID: 22529293 Free PMC article.
-
Choroid plexus-selective inactivation of adenosine A2A receptors protects against T cell infiltration and experimental autoimmune encephalomyelitis.J Neuroinflammation. 2022 Feb 18;19(1):52. doi: 10.1186/s12974-022-02415-z. J Neuroinflammation. 2022. PMID: 35180864 Free PMC article.
-
Inosine, an Endogenous Purine Nucleoside, Suppresses Immune Responses and Protects Mice from Experimental Autoimmune Encephalomyelitis: a Role for A2A Adenosine Receptor.Mol Neurobiol. 2017 Jul;54(5):3271-3285. doi: 10.1007/s12035-016-9893-3. Epub 2016 Apr 30. Mol Neurobiol. 2017. PMID: 27130268
-
Adenosine A2A Receptor Signaling in the Immunopathogenesis of Experimental Autoimmune Encephalomyelitis.Front Immunol. 2018 Mar 6;9:402. doi: 10.3389/fimmu.2018.00402. eCollection 2018. Front Immunol. 2018. PMID: 29559972 Free PMC article. Review.
-
Involvement of the choroid plexus in central nervous system inflammation.Microsc Res Tech. 2001 Jan 1;52(1):112-29. doi: 10.1002/1097-0029(20010101)52:1<112::AID-JEMT13>3.0.CO;2-5. Microsc Res Tech. 2001. PMID: 11135454 Review.
Cited by
-
The adenosinergic signaling in the pathogenesis and treatment of multiple sclerosis.Front Immunol. 2022 Jul 28;13:946698. doi: 10.3389/fimmu.2022.946698. eCollection 2022. Front Immunol. 2022. PMID: 35967385 Free PMC article. Review.
-
The Purinergic System as a Pharmacological Target for the Treatment of Immune-Mediated Inflammatory Diseases.Pharmacol Rev. 2019 Jul;71(3):345-382. doi: 10.1124/pr.117.014878. Pharmacol Rev. 2019. PMID: 31235653 Free PMC article. Review.
-
Adenosine A2A receptor controls the gateway of the choroid plexus.Purinergic Signal. 2023 Mar;19(1):135-144. doi: 10.1007/s11302-022-09847-5. Epub 2022 Feb 15. Purinergic Signal. 2023. PMID: 35167016 Free PMC article.
-
Comprehensive Analyses of Bone and Cartilage Transcriptomes Evince Ion Transport, Inflammation and Cartilage Development-Related Genes Involved in Chickens' Femoral Head Separation.Animals (Basel). 2022 Mar 20;12(6):788. doi: 10.3390/ani12060788. Animals (Basel). 2022. PMID: 35327184 Free PMC article.
-
The Role of Extracellular Adenosine Generation in the Development of Autoimmune Diseases.Mediators Inflamm. 2018 Mar 26;2018:7019398. doi: 10.1155/2018/7019398. eCollection 2018. Mediators Inflamm. 2018. PMID: 29769837 Free PMC article. Review.
References
-
- Lossinsky AS, Shivers RR. Structural pathways for macromolecular and cellular transport across the blood–brain barrier during inflammatory conditions. Review. Histol Histopathol. 2004;19:535–564. - PubMed
-
- Runia TF, van Pelt-Gravesteijn ED, Hintzen RQ. Recent Gains in Clinical Multiple Sclerosis Research. CNS Neurol Disord Drug Targets. 2012;5:497–505. - PubMed
Publication types
MeSH terms
Substances
Grants and funding
LinkOut - more resources
Full Text Sources
Research Materials
Miscellaneous
