

EasyLCMS: an asynchronous web application for the automated quantification of LC-MS data
- PMID: 22884039
- PMCID: PMC3494514
- DOI: 10.1186/1756-0500-5-428
EasyLCMS: an asynchronous web application for the automated quantification of LC-MS data
Abstract
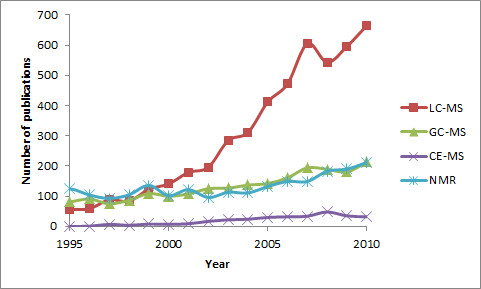
Background: Downstream applications in metabolomics, as well as mathematical modelling, require data in a quantitative format, which may also necessitate the automated and simultaneous quantification of numerous metabolites. Although numerous applications have been previously developed for metabolomics data handling, automated calibration and calculation of the concentrations in terms of μmol have not been carried out. Moreover, most of the metabolomics applications are designed for GC-MS, and would not be suitable for LC-MS, since in LC, the deviation in the retention time is not linear, which is not taken into account in these applications. Moreover, only a few are web-based applications, which could improve stand-alone software in terms of compatibility, sharing capabilities and hardware requirements, even though a strong bandwidth is required. Furthermore, none of these incorporate asynchronous communication to allow real-time interaction with pre-processed results.
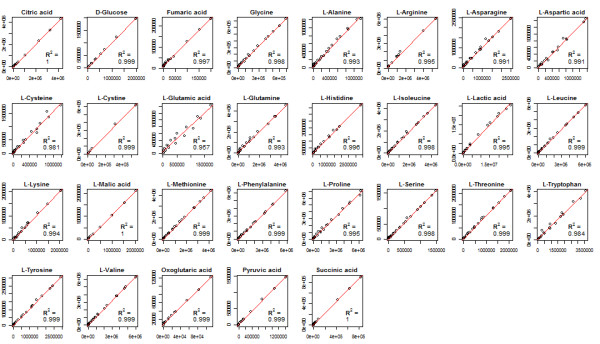
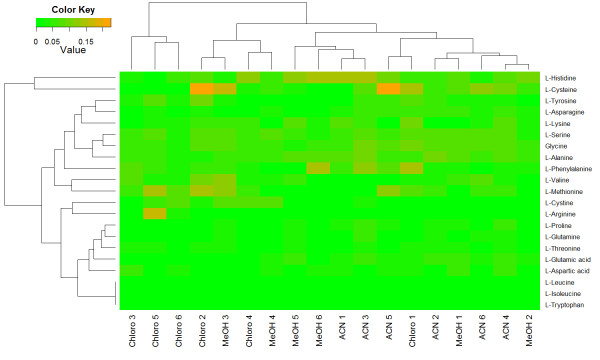
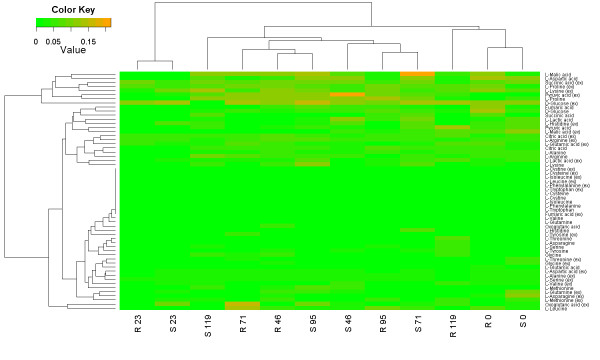
Findings: Here, we present EasyLCMS (http://www.easylcms.es/), a new application for automated quantification which was validated using more than 1000 concentration comparisons in real samples with manual operation. The results showed that only 1% of the quantifications presented a relative error higher than 15%. Using clustering analysis, the metabolites with the highest relative error distributions were identified and studied to solve recurrent mistakes.
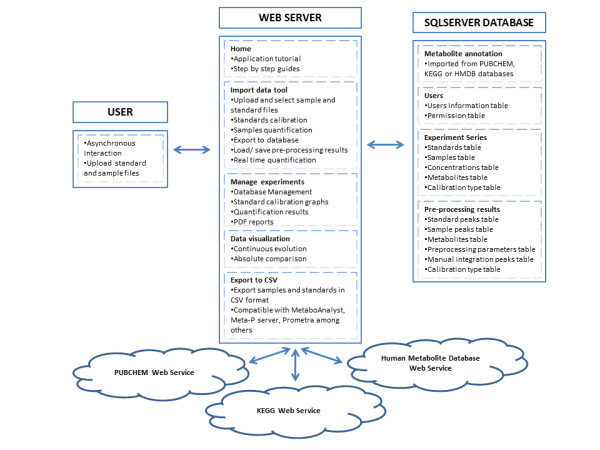
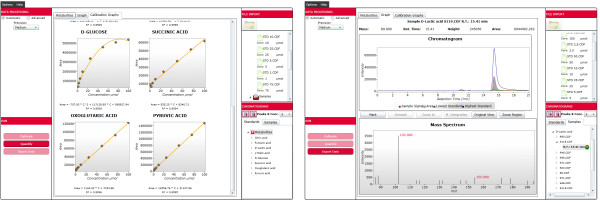
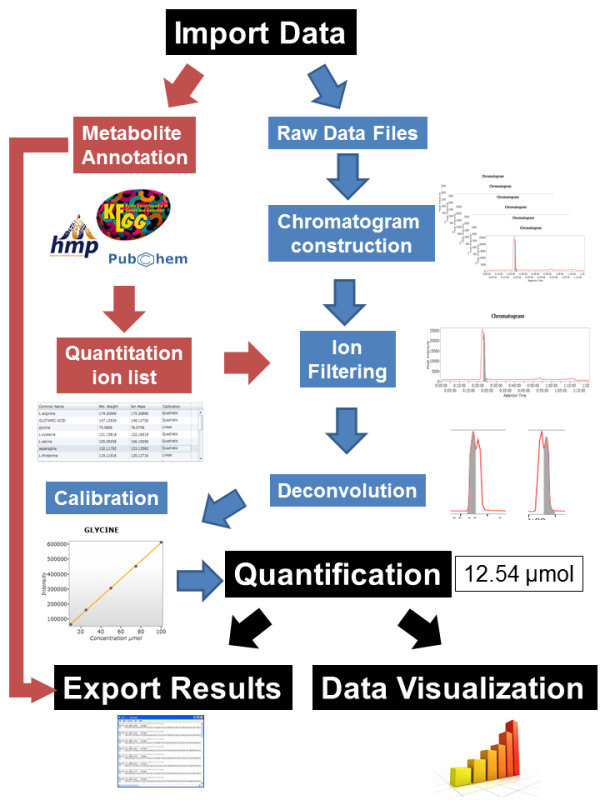
Conclusions: EasyLCMS is a new web application designed to quantify numerous metabolites, simultaneously integrating LC distortions and asynchronous web technology to present a visual interface with dynamic interaction which allows checking and correction of LC-MS raw data pre-processing results. Moreover, quantified data obtained with EasyLCMS are fully compatible with numerous downstream applications, as well as for mathematical modelling in the systems biology field.
Figures
Similar articles
-
Automated Comparative Metabolite Profiling of Large LC-ESIMS Data Sets in an ACD/MS Workbook Suite Add-in, and Data Clustering on a New Open-Source Web Platform FreeClust.Anal Chem. 2017 Dec 5;89(23):12682-12689. doi: 10.1021/acs.analchem.7b02221. Epub 2017 Nov 15. Anal Chem. 2017. PMID: 29087694
-
Optimization of XCMS parameters for LC-MS metabolomics: an assessment of automated versus manual tuning and its effect on the final results.Metabolomics. 2020 Jan 10;16(1):14. doi: 10.1007/s11306-020-1636-9. Metabolomics. 2020. PMID: 31925557
-
SCALiR: A Web Application for Automating Absolute Quantification of Mass Spectrometry-Based Metabolomics Data.Anal Chem. 2024 Apr 30;96(17):6566-6574. doi: 10.1021/acs.analchem.3c04988. Epub 2024 Apr 20. Anal Chem. 2024. PMID: 38642077
-
Current state-of-the-art of nontargeted metabolomics based on liquid chromatography-mass spectrometry with special emphasis in clinical applications.J Chromatogr A. 2014 Dec 29;1374:1-13. doi: 10.1016/j.chroma.2014.11.050. Epub 2014 Nov 23. J Chromatogr A. 2014. PMID: 25444251 Review.
-
Metabolomic Strategies Involving Mass Spectrometry Combined with Liquid and Gas Chromatography.Adv Exp Med Biol. 2017;965:77-98. doi: 10.1007/978-3-319-47656-8_4. Adv Exp Med Biol. 2017. PMID: 28132177 Review.
Cited by
-
Systematic production of inactivating and non-inactivating suppressor mutations at the relA locus that compensate the detrimental effects of complete spot loss and affect glycogen content in Escherichia coli.PLoS One. 2014 Sep 4;9(9):e106938. doi: 10.1371/journal.pone.0106938. eCollection 2014. PLoS One. 2014. PMID: 25188023 Free PMC article.
-
Effect of partially protected butyrate used as feed additive on growth and intestinal metabolism in sea bream (Sparus aurata).Fish Physiol Biochem. 2013 Dec;39(6):1567-80. doi: 10.1007/s10695-013-9809-3. Epub 2013 Jun 5. Fish Physiol Biochem. 2013. PMID: 23737146
-
From chromatogram to analyte to metabolite. How to pick horses for courses from the massive web resources for mass spectral plant metabolomics.Gigascience. 2017 Jul 1;6(7):1-20. doi: 10.1093/gigascience/gix037. Gigascience. 2017. PMID: 28520864 Free PMC article. Review.
-
Haystack, a web-based tool for metabolomics research.BMC Bioinformatics. 2014;15 Suppl 11(Suppl 11):S12. doi: 10.1186/1471-2105-15-S11-S12. Epub 2014 Oct 21. BMC Bioinformatics. 2014. PMID: 25350247 Free PMC article.
References
Publication types
MeSH terms
LinkOut - more resources
Full Text Sources
Miscellaneous
