. 2012 Nov 15;252(1-2):40-8.
doi: 10.1016/j.jneuroim.2012.07.009. Epub 2012 Aug 9.

Tubby regulates microglial phagocytosis through MerTK

Affiliations

Tubby regulates microglial phagocytosis through MerTK

Nora B Caberoy et al. J Neuroimmunol. .

Abstract

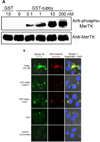
Immunologically-silent microglial phagocytosis of apoptotic cells and cellular debris is critical for CNS homeostasis and innate immune balance. The beneficial and detrimental effects of microglial phagocytosis on neurons remain controversial. Phagocytosis ligands are the key to selecting extracellular cargos, initiating the engulfment process, defining phagocyte functional roles and regulating phagocyte activities with therapeutic potentials. Here we characterized tubby as a new ligand to regulate microglial phagocytosis through MerTK receptor, which is well known for its immunosuppressive signaling. Tubby at 0.1nM significantly induced microglial phagocytosis of apoptotic cells with a maximal activity at 10nM. Tubby activated MerTK with receptor autophosphorylation in a similar dose range. Excessive soluble MerTK extracellular domain blocked tubby-mediated microglial phagocytosis of plasma membrane vesicles as cellular debris. Immunocytochemistry revealed that the ingested cargos were co-localized with MerTK-dependent non-muscle myosin II, whose rearrangement is necessary for cargo engulfment. Phagosome biomarker Rab7 was colocalized with cargos, suggesting that internalized cargos were targeted to phagocytic pathway. Tubby stimulated phagocytosis by neonatal and aged microglia with similar activities, but not by MerTK(-/-) microglia. These results suggest that tubby is a ligand to facilitate microglial phagocytosis through MerTK for the maintenance of CNS homeostasis.


Figures

Fig. 1
Fig. 1
Microglial phagocytosis. (A) pHrodo is a pH-sensitive fluorescence dye. Jurkat cells were harvested, labeled with pHrodo, treated with different pH buffer and analyzed by confocal microscopy. (B) BV-2 cell phagocytosis in the presence or absence of tubby. pHrodo-labeled apoptotic or healthy Jurkat cells were incubated with BV-2 cells in the presence of purified GST-tubby or GST control (10 nM) for phagocytosis for 3 h. Phagocytosed pHrodo-Jurkat cells were analyzed by confocal microscopy. The DAPI signal for nuclei and pHrodo signal for ingested cargos from the same z-stack are superimposed with the cognate bright field to reveal the phagocytosed cargos. Only apoptotic Jurkat cells are shown here. Bar = 25 µm. (C) Relative fluorescence intensity per cell in (B) was quantified in more than 100 cells per group (± SEM, n>100; Tukey-Kramer test).
Fig. 1
Fig. 1
Microglial phagocytosis. (A) pHrodo is a pH-sensitive fluorescence dye. Jurkat cells were harvested, labeled with pHrodo, treated with different pH buffer and analyzed by confocal microscopy. (B) BV-2 cell phagocytosis in the presence or absence of tubby. pHrodo-labeled apoptotic or healthy Jurkat cells were incubated with BV-2 cells in the presence of purified GST-tubby or GST control (10 nM) for phagocytosis for 3 h. Phagocytosed pHrodo-Jurkat cells were analyzed by confocal microscopy. The DAPI signal for nuclei and pHrodo signal for ingested cargos from the same z-stack are superimposed with the cognate bright field to reveal the phagocytosed cargos. Only apoptotic Jurkat cells are shown here. Bar = 25 µm. (C) Relative fluorescence intensity per cell in (B) was quantified in more than 100 cells per group (± SEM, n>100; Tukey-Kramer test).
Fig. 2
Fig. 2
Tubby-mediated microglial engulfment targets to phagosomes. (A) Microglial phagocytosis stimulated by GST-tubby. Plasma membrane vesicles were prepared from Neuro-2a (N2a) cells, labeled with pHrodo and incubated with BV-2 microglia in the presence of GST-tubby or GST (10 nM) for phagocytosis. Phagosome marker Rab7 was detected using anti-Rab7 antibodies and FITC-labeled secondary antibodies, and analyzed by confocal microscopy. pHrodo signals and FITC signals are co-localized and superimposed with DAPI signals and the cognate bright field. Bar = 25 µm. (B) Microglial phagocytosis with FLAG-tubby. Phagocytosis assay was performed with purified FLAG-tubby or mock control as in (A). Bar = 10 µm. (C) Relative fluorescence intensity per cell in (B) was quantified in more than 100 cells per group (± SEM, n>100; t-test).
Fig. 2
Fig. 2
Tubby-mediated microglial engulfment targets to phagosomes. (A) Microglial phagocytosis stimulated by GST-tubby. Plasma membrane vesicles were prepared from Neuro-2a (N2a) cells, labeled with pHrodo and incubated with BV-2 microglia in the presence of GST-tubby or GST (10 nM) for phagocytosis. Phagosome marker Rab7 was detected using anti-Rab7 antibodies and FITC-labeled secondary antibodies, and analyzed by confocal microscopy. pHrodo signals and FITC signals are co-localized and superimposed with DAPI signals and the cognate bright field. Bar = 25 µm. (B) Microglial phagocytosis with FLAG-tubby. Phagocytosis assay was performed with purified FLAG-tubby or mock control as in (A). Bar = 10 µm. (C) Relative fluorescence intensity per cell in (B) was quantified in more than 100 cells per group (± SEM, n>100; t-test).
Fig. 3
Fig. 3
Tubby facilitates microglial phagocytosis through MerTK receptor. (A) Tubby induces MerTK activation in a dose-dependent manner. BV-2 cells were incubated with GST-tubby or GST control at the indicated concentrations. MerTK was precipitated with anti-MerTK antibodies from the cell lysates, analyzed by Western blot using anti-phospho-MerTK or anti-MerTK antibodies. (B) Co-localization of phagocytosed cargos with NMMII-A. pHrodo-labeled plasma membrane vesicles were preincubated with GST-tubby, GST-tubby-ΔC44 or GST (10 nM), washed to remove the unbound proteins and incubated with BV-2 microglial cells for phagocytosis in the presence or absence of excess MerFc (2.5 µg/ml). NMMII-A was detected using anti-NMMII-A antibodies and FITC-labeled secondary antibodies. Co-localization of pHrodo signals and FITC was analyzed by confocal microscopy. Bar = 25 µm. (C) Relative fluorescence intensity of pHrodo per cell in (B) was quantified in more than 100 cells per group (± SEM, n>100; Tukey-Kramer test).
Fig. 3
Fig. 3
Tubby facilitates microglial phagocytosis through MerTK receptor. (A) Tubby induces MerTK activation in a dose-dependent manner. BV-2 cells were incubated with GST-tubby or GST control at the indicated concentrations. MerTK was precipitated with anti-MerTK antibodies from the cell lysates, analyzed by Western blot using anti-phospho-MerTK or anti-MerTK antibodies. (B) Co-localization of phagocytosed cargos with NMMII-A. pHrodo-labeled plasma membrane vesicles were preincubated with GST-tubby, GST-tubby-ΔC44 or GST (10 nM), washed to remove the unbound proteins and incubated with BV-2 microglial cells for phagocytosis in the presence or absence of excess MerFc (2.5 µg/ml). NMMII-A was detected using anti-NMMII-A antibodies and FITC-labeled secondary antibodies. Co-localization of pHrodo signals and FITC was analyzed by confocal microscopy. Bar = 25 µm. (C) Relative fluorescence intensity of pHrodo per cell in (B) was quantified in more than 100 cells per group (± SEM, n>100; Tukey-Kramer test).
Fig. 4
Fig. 4
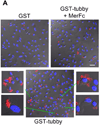
Tubby facilitates primary microglial phagocytosis. (A) Primary microglial phagocytosis. pHrodo-labeled membrane vesicles were preincubated with GST-tubby or GST, washed, incubated with primary neonatal microglia for phagocytosis in the presence or absence of excess MerFc and analyzed by confocal microscopy as in Fig. 3. Bar = 20 µm. (B) Percentage of microglia with internalized pHrodo signal were quantified (± SEM, n>100; t-test).
Fig. 4
Fig. 4
Tubby facilitates primary microglial phagocytosis. (A) Primary microglial phagocytosis. pHrodo-labeled membrane vesicles were preincubated with GST-tubby or GST, washed, incubated with primary neonatal microglia for phagocytosis in the presence or absence of excess MerFc and analyzed by confocal microscopy as in Fig. 3. Bar = 20 µm. (B) Percentage of microglia with internalized pHrodo signal were quantified (± SEM, n>100; t-test).
Fig. 5
Fig. 5
Tubby stimulates phagocytosis by neonatal and aged microglia with similar activities. (A) Purity of primary microglia. Neonatal and aged microglia were prepared from mouse brain at 4–8 days and 15 months of age, respectively, and analyzed by flow cytometry using APC/Cy7-labeled anti-CD11b antibodies. The purity of neonatal and aged microglia was 99.7% and 98.4%, respectively. (B) Morphology of primary microglia under light microscope (20X amplification). (C) Phagocytosis by neonatal or aged microglia. pHrodo-labeled membrane vesicles were prepared and used for microglial phagocytosis as in Fig. 2. Bar = 10 µm. (D) Relative fluorescence intensity of pHrodo per cell in (C) was quantified in more than 100 cells per group (± SEM, n>100, *p<0.001).
Fig. 5
Fig. 5
Tubby stimulates phagocytosis by neonatal and aged microglia with similar activities. (A) Purity of primary microglia. Neonatal and aged microglia were prepared from mouse brain at 4–8 days and 15 months of age, respectively, and analyzed by flow cytometry using APC/Cy7-labeled anti-CD11b antibodies. The purity of neonatal and aged microglia was 99.7% and 98.4%, respectively. (B) Morphology of primary microglia under light microscope (20X amplification). (C) Phagocytosis by neonatal or aged microglia. pHrodo-labeled membrane vesicles were prepared and used for microglial phagocytosis as in Fig. 2. Bar = 10 µm. (D) Relative fluorescence intensity of pHrodo per cell in (C) was quantified in more than 100 cells per group (± SEM, n>100, *p<0.001).

Similar articles

Cited by

References

    1. Almolda B, Gonzalez B, Castellano B. Antigen presentation in EAE: role of microglia, macrophages and dendritic cells. Front Biosci. 2011;16:1157–1171. - PubMed
    1. Caberoy NB, Alvarado G, Bigcas JL, Li W. Galectin-3 is a new MerTK-specific eat-me signal. J Cell Physiol. 2012;227:401–407. - PMC - PubMed
    1. Caberoy NB, Maiguel D, Kim Y, Li W. Identification of tubby and tubby-like protein 1 as eat-me signals by phage display. Exp Cell Res. 2010a;316:245–257. - PMC - PubMed
    1. Caberoy NB, Zhou Y, Jiang X, Alvarado G, Li W. Efficient identification of tubby-binding proteins by an improved system of T7 phage display. J Mol Recognit. 2010b;23:74–83. - PMC - PubMed
    1. Caberoy NB, Zhou Y, Li W. Can phage display be used as a tool to functionally identify endogenous eat-me signals in phagocytosis? J Biomol Screen. 2009;14:653–661. - PMC - PubMed

Publication types

MeSH terms