. 2012 Aug 9;75(3):503-16.
doi: 10.1016/j.neuron.2012.05.027.

Enhancement of dorsal hippocampal activity by knockdown of HCN1 channels leads to anxiolytic- and antidepressant-like behaviors

Affiliations

Enhancement of dorsal hippocampal activity by knockdown of HCN1 channels leads to anxiolytic- and antidepressant-like behaviors

Chung Sub Kim et al. Neuron. .

Abstract

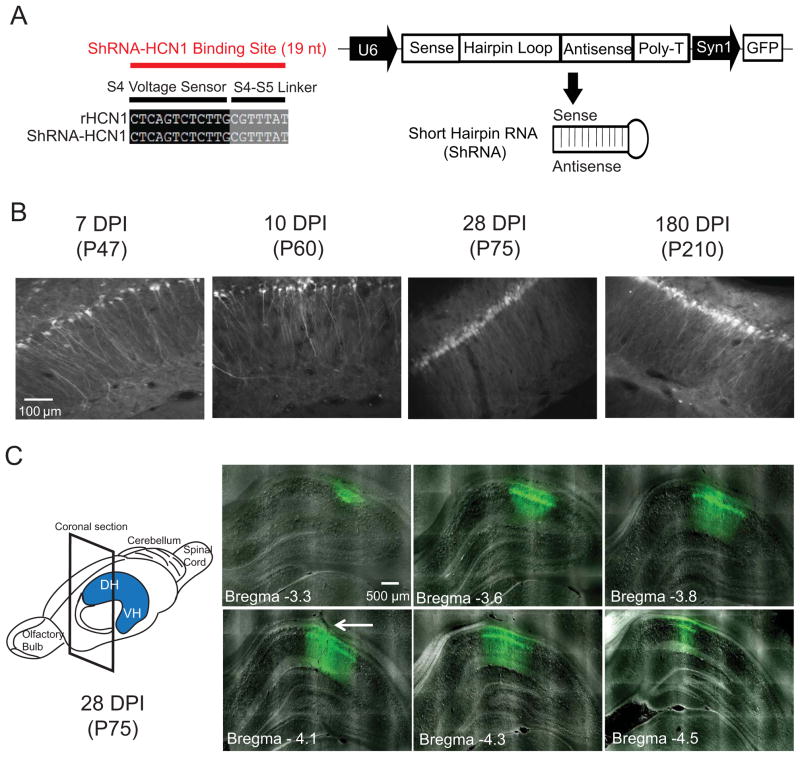
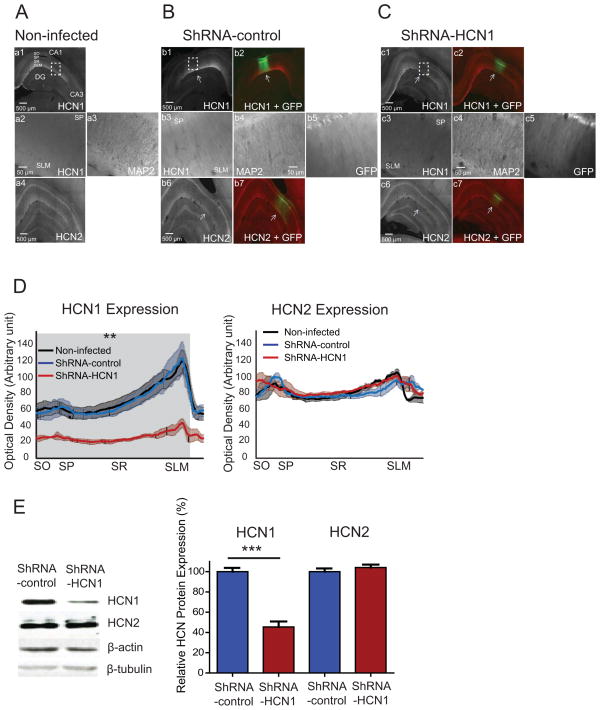
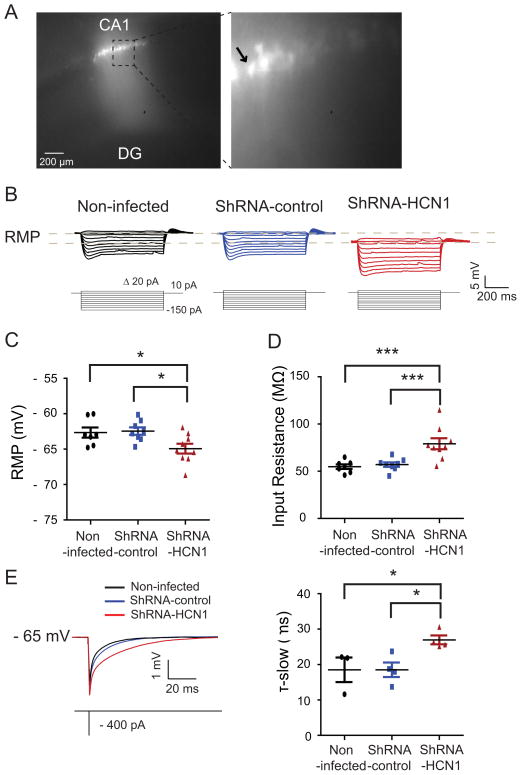
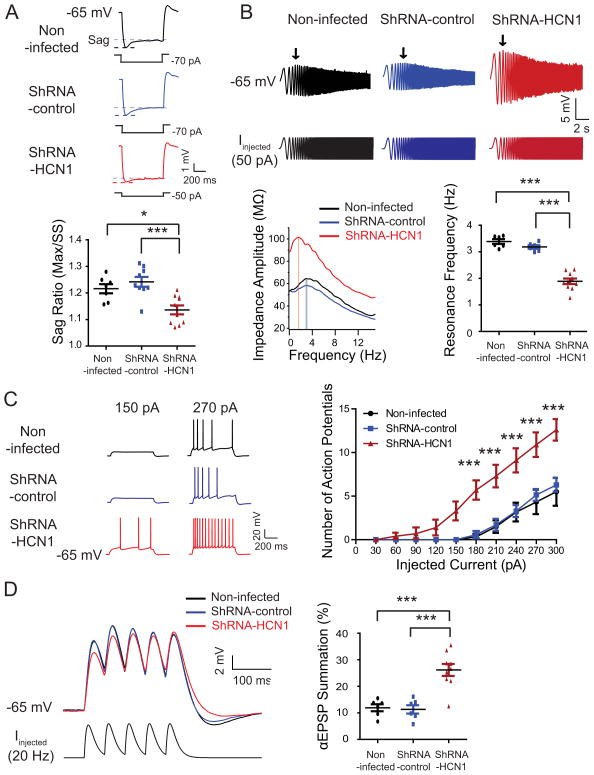
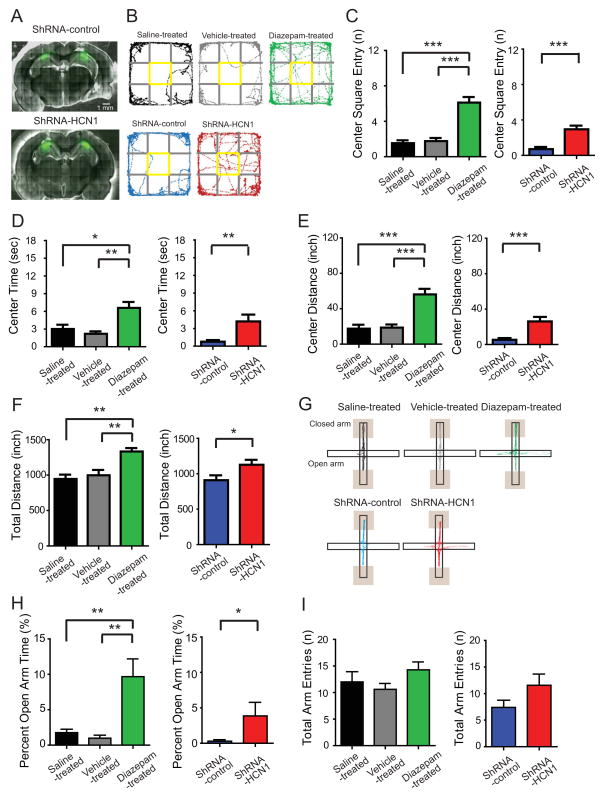
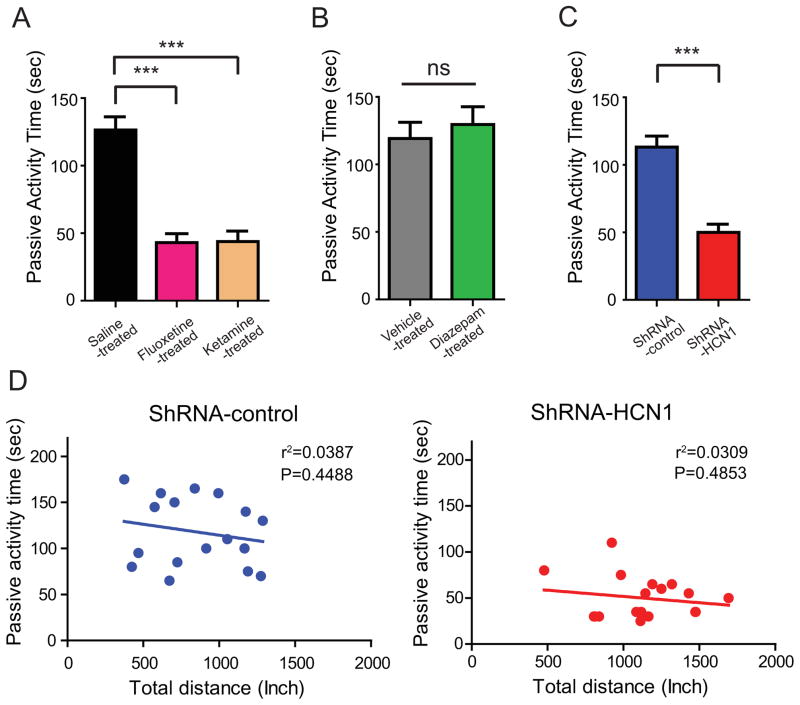
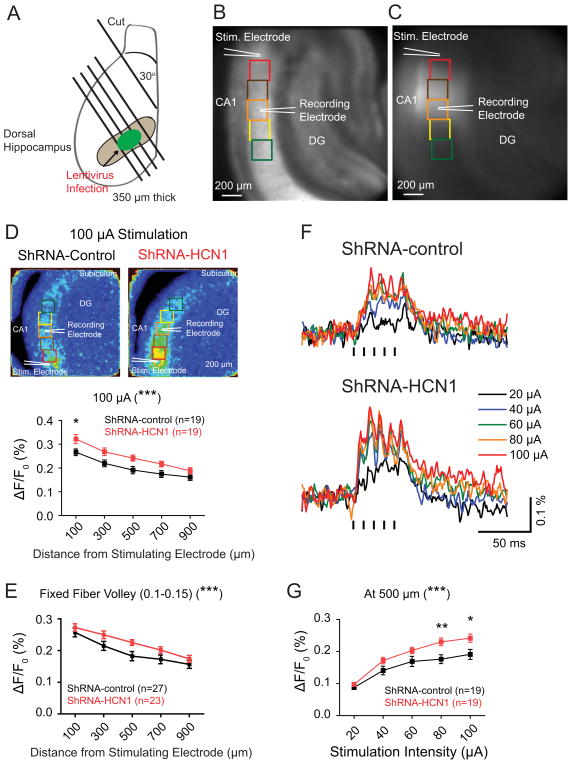
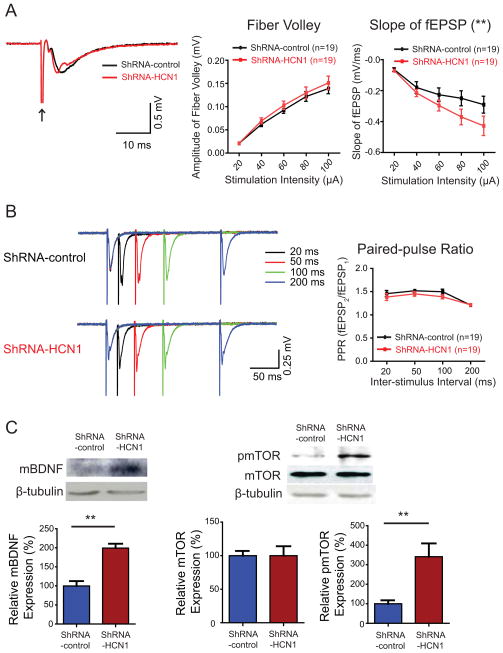
The hippocampus is an integral brain region for affective disorders. TRIP8b knockout mice lacking functional HCN channels as well as both HCN1 and HCN2 knockout mice have been shown to display antidepressant-like behaviors. The mechanisms or brain regions involved in these alterations in behavior, however, are not clear. We developed a lentiviral shRNA system to examine whether knockdown of HCN1 protein in the dorsal hippocampal CA1 region is sufficient to produce antidepressant-like effects. We found that knockdown of HCN1 channels increased cellular excitability and resulted in physiological changes consistent with a reduction of I(h). Rats infused with lentiviral shRNA-HCN1 in the dorsal hippocampal CA1 region displayed antidepressant- and anxiolytic-like behaviors associated with widespread enhancement of hippocampal activity and upregulation of BDNF-mTOR signaling pathways. Our results suggest that HCN1 protein could be a potential target for treatment of anxiety and depression disorders.


Figures

Figure 1
Figure 1. Lentivirus expressing shRNA-HCN1 in the CA1 region of dorsal hippocampus
(A) A schematic diagram showing the lentiviral shRNA expression vector system. The 19 nucleotide shRNA is specific to the HCN1 gene. In dual promoter vector system, shRNA is under control of U6 promoter and GFP is controlled by synapsin1 promoter. (B) Expression of lentivirus over time in the dorsal CA1 region. Rats infused with lentivirus in the dorsal hippocampal CA1 region were transcardially perfused on day 7, 10, 28, and 180 after infusion (days post infusion, DPI). The ages of animals are in parentheses (postnatal day). (C) Distribution of lentivirus in the dorsal hippocampal CA1 region. A single infusion of lentivirus spread out mediolaterally (about 0.7 – 1.0 mm) and anteroposteriorly (about 1.2–1.6 mm). The arrow indicates the injection track. DH: Dorsal hippocampus: VH: Ventral hippocampus
Figure 2
Figure 2. Specific knockdown of HCN1 by lentiviral-shRNA-HCN1 in the CA1 region of the dorsal hippocampus
(A) 70-μm-thick dorsal hippocampal slices from non-infected rats were immunolabeled with HCN1 (a1, a2), HCN2 (a4), and dendritic marker MAP2 (a3). a2 and a3 are enlarged from the dashed box. (B) In the shRNA-control-infected dorsal hippocampal CA1 region, protein expression of HCN1 (b1, b3), HCN2 (b6), and MAP2 (b4) were similar to non-infected group. b3, b4, and b5 are enlarged from the dashed box. The labeling of HCN1 (b1) and HCN2 protein (b6) were superimposed with GFP expression in b2 and b7. The arrows indicate lentivirus-infected CA1 region. (C) In the ShRNA-HCN1-infected dorsal hippocampal CA1 region, protein expression of HCN1 (c1, c3) was significantly reduced without affecting the expression of HCN2 (c6) and MAP2 (c4). c3, c4, and c5 are enlarged from the dashed box in c1. The labeling of HCN1 (c1) and HCN2 protein (c6) were superimposed with GFP expression in c2 and c7. (D) Quantification of HCN1 and HCN2 protein expression from the perisomatic region to the distal dendritic area in the CA1 region. The gray shade indicates significant difference in HCN1 protein expression between shRNA-HCN1-infected region (n=3) and non-infected (n=3) or shRNA-control-infected regions (n=3) (Unpaired t-test). There was no significant difference in HCN2 protein expression from the perisomatic region to the distal dendritic area in the CA1 region (Unpaired t-test). (E) Western blotting of shRNA-control-infected (n=7) and shRNA-HCN1-infected (n=7) CA1 lysates with antibodies against HCN1, HCN2, β-actin, and β-tubulin. The protein expression of HCN1 and HCN2 were quantified and normalized by β-tubulin. The right displays the summary of HCN1 and HCN2 protein expression in shRNA-control-infected and shRNA-HCN1-infected regions. Data are expressed as mean ± SEM. **p < 0.01, and ***p < 0.001 compared with non-infected or lentiviral-shRNA-control-infected group. SO: Stratum Oriens; SP: Stratum Pyramidale; SR: Stratum Radiatum; SLM: Stratum Lacunosum Moleculare.
Figure 3
Figure 3. Alteration in intrinsic membrane properties by knockdown of HCN1 in the dorsal CA1 pyramidal neurons
(A) Photomicrograph of a representative recorded lentivirus-infected dorsal CA1 pyramidal neurons. The left displays photomicrograph of lentivirus-infected dorsal hippocampal CA1 region. The right enlarged from the dashed box. The arrow indicates the recorded pyramidal neuron. (B) Representative voltage responses with step current commands ranging from -150 pA to +10 pA (Δ=20 pA) at resting membrane potential. (C) ShRNA-HCN1-infected CA1 pyramidal neurons (n=9) displayed hyperpolarized membrane potential as compared to non-infected- (n=7) or shRNA-control-infected (n=8) pyramidal neurons. (D) Knockdown of HCN1 in the dorsal CA1 pyramidal neurons (n=9) resulted in higher input resistance than non-infected- (n=7) or shRNA-control-infected (n=8) pyramidal neurons. (E) ShRNA-HCN1-infected pyramidal neurons (n=4) displayed slower time constant compared to non-infected- (n=3) or shRNA-control-infected (n=4) pyramidal neurons. The top displays representative traces and current commands. ShRNA-HCN1-infected neurons were compared with non-infected or shRNA-control-infected CA1 pyramidal neurons. Data are expressed as mean ± SEM. *p < 0.05 and ***p < 0.001.
Figure 4
Figure 4. Knockdown of HCN1 induced physiological changes consistent with reduction of Ih in the dorsal CA1 pyramidal neurons
For proper comparison between groups, CA1 pyramidal neurons were held at -65 mV. (A) ShRNA-HCN1-infected CA1 pyramidal neurons (n=10) showed less voltage sag compared to non-infected- (n=7) or shRNA-control-infected pyramidal neurons (n=9). The left are representative voltage traces and current commands. The sag is defined as the ratio of the maximum hyperpolarization (Max) to the steady-state hyperpolarization (SS). (B) ShRNA-HCN1-infected pyramidal neurons (n=10) had lower membrane resonance frequency than non-infected- (n=6) or shRNA-control-infected pyramidal neurons (n=6). The top are representative voltage traces and current commands. The arrows point to the maximum depolarization. The bottom left displays the profile of impedance amplitude. The resonance frequencies are marked by vertical lines. (C) ShRNA-HCN1-infected pyramidal neurons (n=10) had more action potentials than non-infected- (n=6) or shRNA-control-infected pyramidal neurons (n=7). The top are representative voltage traces. (D) Knockdown of HCN1 in dorsal CA1 pyramidal neurons (n=9) resulted in higher αEPSP summation as compared to non-infected- (n=6) or shRNA-control-infected pyramidal neurons (n=6). The left are representative voltage traces and current commands. Data are expressed as mean ± SEM. *p < 0.05, **p < 0.01, and ***p < 0.001 compared with non-infected or shRNA-control-infected CA1 pyramidal neurons.
Figure 5
Figure 5. Knockdown of HCN1 by lentiviral-shRNA-HCN1 in the CA1 region of the dorsal hippocampus produced anxiolytic-like effect in the open field test and elevated plus maze test
(A) Representative coronal sections of the brains display the areas infected by lentivirus (green). (B) Representative video tracking images during the last 5 min of open field test of age-matched individual rats treated with saline (i.p.), vehicle (i.p.), diazepam (1 mg/kg i.p.) or infected with lentiviral shRNA-control (infusion in dorsal CA1 region) or shRNA-HCN1 (infusion in dorsal CA1 region). During the open field test, the number of center square entries (C), the duration (D), and the travelled distance (E) in the center square were measured. Like diazepam-treated rats, shRNA-HCN1-infected rats showed significantly increased center square entries, center time, and center distance compared to shRNA-control-infected rats, indicating anxiolytic-like behaviors. (F) Like diazepam-induced hyperexploration in the open field test, shRNA-HCN1-infected rats also showed increased exploration activity compared to shRNA-control-infected rats for the last 5 min of the test. (G) Representative video tracking images during the 6 min of elevated plus maze test of age-matched individual rats treated with saline (i.p.), vehicle (i.p.), diazepam (i.p.) or infected with lentiviral shRNA-control or shRNA-HCN1. The traces do not include locations near the end of closed arms since it is too dim to reliably recognize the body center (Shaded boxes). During the elevated plus maze test, the percentage of open arm time (H) was measured. Similar to the diazepam-induced increase in the percentage of open arm time, shRNA-HCN1-infected rats displayed significantly higher percentage of open arm time compared to shRNA-control-infected rats. (I) There is no significant difference in total arm entries between groups. Data are expressed as mean ± SEM with significance indicated by *p < 0.05, **p < 0.01, and ***p < 0.001.
Figure 6
Figure 6. Knockdown of HCN1 by lentiviral-shRNA-HCN1 in the CA1 region of the dorsal hippocampus promoted antidepressant-like effects in the forced swim test
(A) 10- to 12-week-old rats were treated with saline i.p. (n=17), 10 mg/kg fluoxetine i.p. (n=13), or 15 mg/kg ketamine i.p. (n=13) 30 min before the forced swim test as a positive control. Rats treated with fluoxetine or ketamine displayed significantly less passive activity time compared to rats treated with saline. (B) Diazepam-treated rats (1mg/kg i.p. n=12) had no effect on the forced swim test compared to vehicle-treated rats (n=13). (C) ShRNA-HCN1-infected rats (n=18) displayed significantly less passive activity time compared to shRNA-control-infected rats (n=17). Behavior despair as indicated by passive activity time was determined in the last 4 min of the forced swim test. (D) There was no significant correlation between the passive activity time (sec) in the forced swim test and the total distance (inch) in the open field test analyzed with linear regression. Data are expressed as mean ± SEM. *p < 0.05, **p < 0.01, and ***p < 0.001.
Figure 7
Figure 7. Knockdown of HCN1 enhanced voltage sensitive dye (VSD) optical signals in the dorsal hippocampal CA1 region
(A) Schematic illustration of the dorsal hippocampal slices prepared from lentivirus-infected animals. (B) Photomicrograph of a representative hippocampal slice displays the location of the stimulating electrode, the recording electrode, and the regions of interest (ROIs). The size of ROIs is 200 × 200 μm. The Stimulating electrode was placed in the stratum radiatum (SR) close to the CA2 region and the recording electrode was placed in the SR of CA1 region, 500 μm away from the stimulating electrodes. (C) A representative image displays the lentivirus-infected dorsal CA1 region. (D) VSD optical signals were widely increased along the CA1 axis in response to a train of stimuli (five, 0.2 ms current pulses at 100 Hz, 100 μA). The left are representative maximal VSD optical signals (color scale: 0–0.6%). (E) Knockdown of HCN1 enhanced widespread VSD optical signals within a fixed range of fiber volley amplitude (0.1–0.15 mV) compared to shRNA-control-infected group. (F) Representative traces of VSD optical signals from the ROIs, 500 μm away from the stimulating electrode, in response to a train of stimuli (five 0.2 ms current pulses at 100 Hz, 20–100 μA). (G) Knockdown of HCN1 enhanced VSD optical signals at the ROI 500 μm from the stimulating electrode in response to a train of stimuli (five 0.2 ms current pulses at 100 Hz, 20–100 μA). Data are expressed as mean ± SEM. *p < 0.05, **p < 0.01, and ***p < 0.001 compared with shRNA-control-infected group.
Figure 8
Figure 8. Enhancement of synaptic transmission and BDNF-mTOR signaling by knockdown of HCN1 in the dorsal CA1 region
(A) Representative traces of field excitatory postsynaptic potentials (fEPSPs) recorded in the median stratum radiatum (SR) of the CA1 region in response to a single stimulation (100 μA, arrow). The slope of fEPSP as a function of stimulation intensity from 20 μA to 100 μA showed significant difference between shRNA-control- and shRNA-HCN1-infected dorsal hippocampal CA1 regions without change in the amplitude of presynaptic fiber volley. (B) Representative traces of fEPSPs evoked by paired pulses at four inter-stimulus intervals (ISI; 20 ms, 50 ms, 100 ms, and 200 ms) in shRNA-control and shRNA-HCN1-infected dorsal hippocampal CA1 region. Paired-pulse ratio was not significantly different between shRNA-control- and shRNA-HCN1-infected dorsal hippocampal CA1 regions. (C) Mature BDNF (mBDNF) protein expression was significantly increased in shRNA-HCN1-infected dorsal CA1 region (n=3) compared to shRNA-control infected group (n=3). mBDNF protein expression was normalized by β-tubulin. Knockdown of HCN1 in dorsal CA1 region (n=6) increased phosphorylation of mTOR compared to shRNA-control-infected group (n=6). Phospho-mTOR protein expression was normalized by total mTOR and β-tubulin. Data are expressed as mean ± SEM. **p < 0.01.

References

    1. Airan RD, Meltzer LA, Roy M, Gong Y, Chen H, Deisseroth K. High-speed imaging reveals neurophysiological links to behavior in an animal model of depression. Science. 2007;317:819–823. - PubMed
    1. Alldredge BK. Seizure risk associated with psychotropic drugs: clinical and pharmacokinetic considerations. Neurology. 1999;53:S 68–75. - PubMed
    1. Autry AE, Adachi M, Nosyreva E, Na ES, Los MF, Cheng PF, Kavalali ET, Monteggia LM. NMDA receptor blockade at rest triggers rapid behavioural antidepressant responses. Nature 2011 - PMC - PubMed
    1. Ball SG, Kuhn A, Wall D, Shekhar A, Goddard AW. Selective serotonin reuptake inhibitor treatment for generalized anxiety disorder: a double-blind, prospective comparison between paroxetine and sertraline. J Clin Psychiatry. 2005;66:94–99. - PubMed
    1. Berman RM, Cappiello A, Anand A, Oren DA, Heninger GR, Charney DS, Krystal JH. Antidepressant effects of ketamine in depressed patients. Biol Psychiatry. 2000;47:351–354. - PubMed

Publication types

MeSH terms

Substances